Utilization Tables
Use Utilization Tables to analyze how planned or logged time compares to time available (i.e. visualize capacity), for Planhat Users and for Teams
Summary
Widget group: Table Widgets
Source data: Field
Description: Displays, in percentages, how much time your Users (Team Members) have forecasted (via Scheduled Time records) or logged (via Time Entries) compared to their available hours, so you can identify under- and over-utilization
Use case examples: Utilization analysis - e.g. identify who within your Team has capacity to take on a new project; identify whether you need an additional Team Member
Who is this article for?
All Planhat Users who work in Service Delivery, Professional Services, Implementation, and so on
It's particularly relevant for:
Planhat Users who are designing Dashboard and Presentation Pages (e.g. Ops)
Planhat Users who manage Teams within Service Delivery / Professional Services
This article is relevant to Planhat Service Automation (PSA), also sometimes referred to as Professional Services or Service Delivery.
If you don't have access to these features and would like to add them, please speak with your Planhat CSM.
Series
Utilization Tables are part of both:
Time tracking (logging past work), summarized here
Resource allocation (forecasting future work), summarized here
Article contents
Introduction
Central to Service Delivery, such as Professional Services, including Implementation and so on, is an understanding of how much time will be or has been spent, on which project/customer etc. As well as being important for billing if you're working on a "time and materials" ("T&M") basis, you'll want to understand the capacity of your Team, especially if you are a Manager - this means knowing the difference between the amount of time your Users have allocated or logged, compared to the amount of working hours they have/had available.
For example, you'll need to answer questions such as:
Are any particular Users (Team Members) consistently under- or over-utilized?
Who should the next big project be assigned to?
What's the capacity of your Team like overall?
If the Team is over-utilized, is this just a short-term peak in work, or should you recruit an additional Team Member?
Are there differences in capacity between different Teams, and if so, why?
Planhat's Utilization Tables, which you can include in Dashboards and Presentations, make it easy for you to answer these sorts of questions. They calculate the percentage utilization (and hence capacity) of Users for you, based on either the time allocated (forecasted data) or the time logged (historical data) in Planhat, and even automatically color-code data to flag any possible issues. As with other Page Widgets (chart types), they are easy to customize to suit your particular needs.
In this article, we'll take you through Utilization Tables (also called Utilization Charts / Utilization Widgets) in further detail - what they are, why they are useful, and how to set them up.
📌 Important to note
When Utilization Tables were first launched, in 2025, they were exclusively based on logged (historical) work, referring to data in the Time Entry model.
While this functionality is still available, in 2026 we introduced an additional option for upcoming (forecasted) work, using the Scheduled Time model. You may hear such a Utilization Table referred to as a "Capacity Planning Widget".
📌 Reminder
The User model represents users of Planhat (i.e. you and your colleagues), while the End User model represents your contacts/customers. You can read more about Planhat models here.
🚀 Tip
Utilization Tables are not the only way to analyze capacity in Planhat.
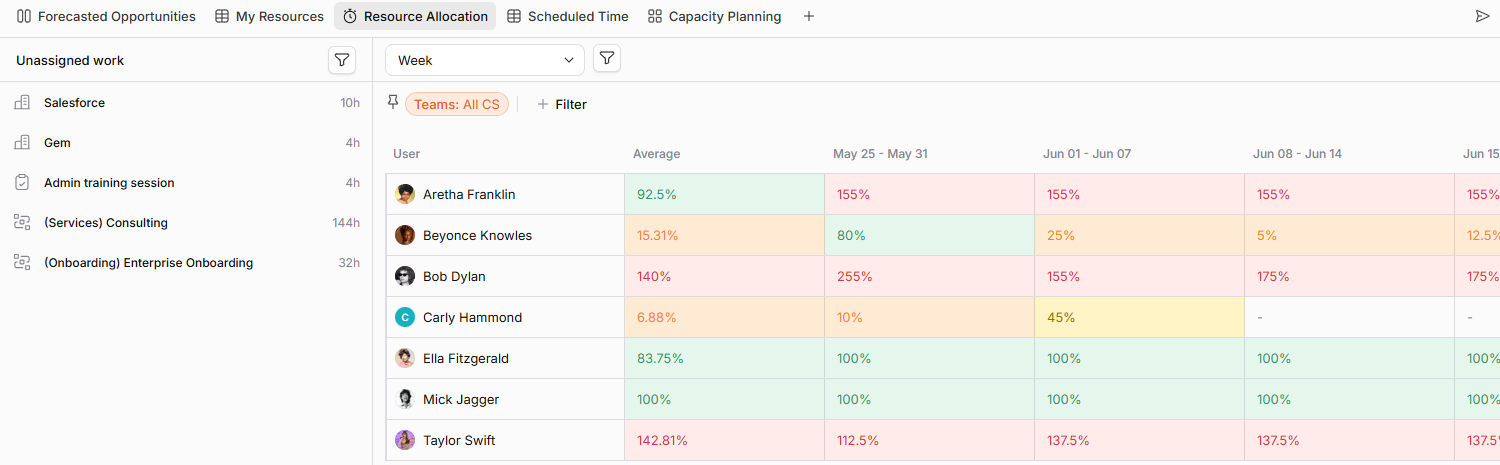
The "Resource Allocation" Page is a System Report Page that is specially designed for assigning Users to upcoming work (via Scheduled Time records). You will notice that the right-hand side of this Page type is effectively a Utilization Table.
You could also create a series of Widgets to visualize the number of open Tasks per User, or the number of active Workflows per User, etc. You can take a look at the Planhat Template Pages (described at the end of this article) for inspiration.
What are Utilization Tables?
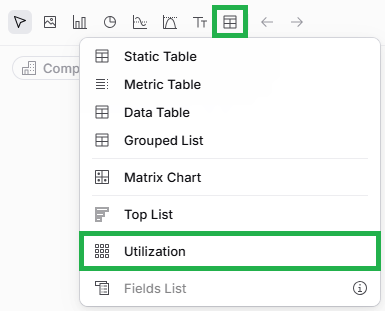
"Utilization" is a type of chart in the "Table Widgets" group, which you can use within Dashboard and Presentation Pages.
Utilization Tables (also sometimes referred to by the alternative spelling Utilisation Tables) display the utilization of Planhat Users (Team Members) - that is, how much of their available (working) time is being used (or at least logged/allocated). Utilization is displayed as percentages, and potential issues are flagged via automatic color coding (with green meaning good, red indicating a possible problem, and yellow/orange somewhere in between; it's also possible to set custom colors).
With Utilization Tables, you can quickly identify which Users are under-utilized or over-utilized (or perhaps aren't completing their Timesheets correctly). They are also useful to review the capacity of Teams as a whole - e.g. if everyone is logging a very high number of hours, perhaps you should recruit a new staff member.
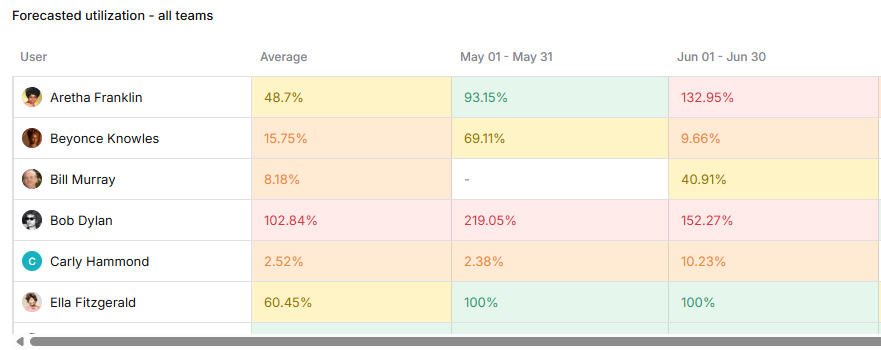
Click the image to view it enlarged
Technical details
Models involved
Utilization is based on:
Either Time Entry - for logged work (historical data - time tracking)
Or Scheduled Time - for upcoming work (forecasted data - capacity planning)
Standard fields
There are two particularly significant system (default/standard) fields on each of these models when it comes to Utilization Tables, which are both toggle switches (i.e. Boolean/checkbox fields).
"Time Off" - you should toggle this field on when you want to track your time off (vacation/holiday/PTO or sick leave etc.)
"Billable" - you use this to specify whether the hours logged should be billed to the customer in a "time and materials" (T&M) type of project (i.e. they are billable), or not (because they are part of a fixed-fee project)
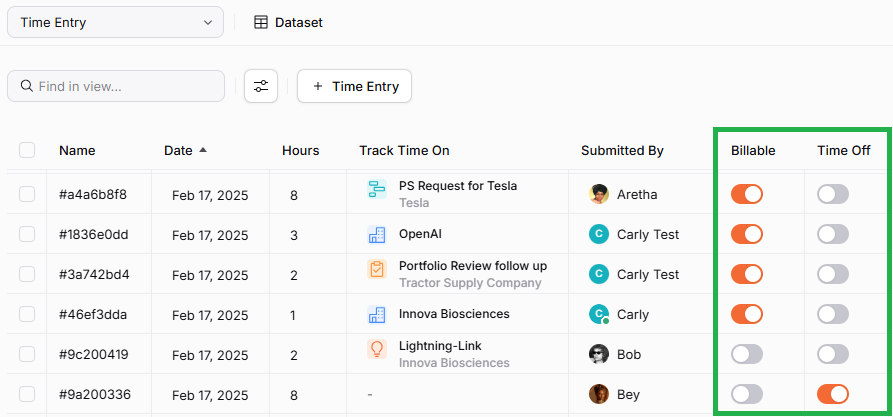
Click the image to view it enlarged
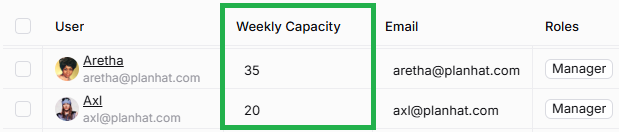
Utilization Tables also use a system (default/standard) field on the User model called "Weekly Capacity", where you can define the number of weekly working hours of each User. If this is not filled in, 40 hours is assumed (i.e. that's the default value).
Standard utilization calculations
In the Utilization Table, by default you can either display/analyze "total utilization" or "billed utilization". "Billed utilization" only includes Time Entries or Scheduled Time records where the "Billable" system (standard/default) field is toggled on.
"Total utilization"
is calculated by:
total hours of Time Entries or Scheduled Time records for the time period (e.g. 30 hours)
divided by: (the weekly capacity of the User (e.g. 40 hours), minus their Time Entries or Scheduled Time records with the "Time Off" field toggled on (e.g. 8 hours))
multiplied by 100 to make a percentage
So in this example, it would be (30 / (40-8) ) x 100 = 93.75% of available hours were utilized
"Billed utilization"
is calculated by:
total hours of Time Entries or Scheduled Time records where the "Billable" field is toggled on for the time period (e.g. 20 hours)
divided by: (the weekly capacity of the User (e.g. 40 hours), minus their Time Entries or Scheduled Time records with the "Time Off" field toggled on (e.g. 8 hours))
multiplied by 100 to make a percentage
So in this example, it would be (20 / (40-8) ) x 100 = 62.5% of available hours were billable
Custom utilization definitions
As an alternative to "Total utilization" and "Billed utilization", you can make your own custom utilization types/definitions, both for "Historical" Utilization Tables (tracking time using Time Entries) and "Forecasted" Utilization Tables (capacity planning using Scheduled Times). For example, you could define "Productive Utilization" or "Admin Utilization", etc.
You create the custom options within the "Services setup" part of the "Settings" Global Tool - specifically ...
... the "Time tracking" tab for "Historical" Utilization Tables (pictured in the example screenshot below),
... and the "Capacity planning" tab for "Forecasted" Utilization Tables.
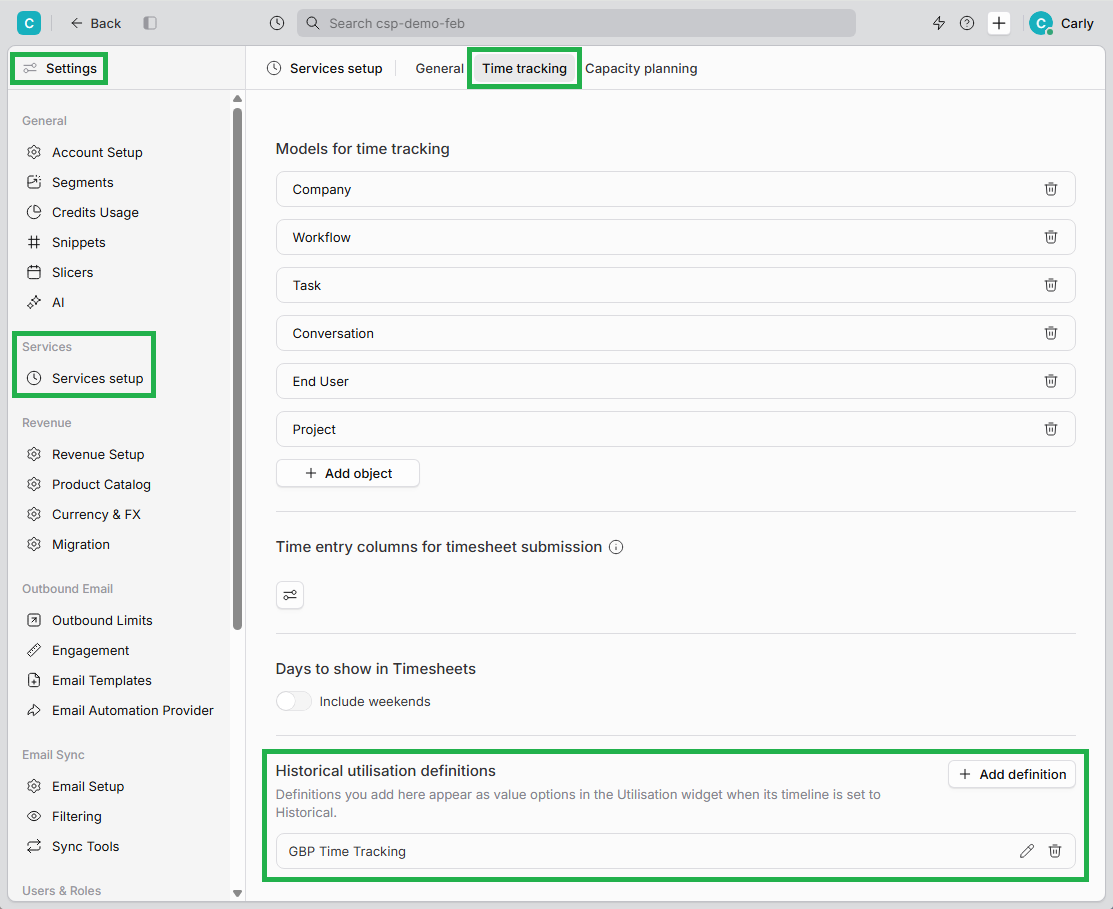
Click the image to view it enlarged
You will find the relevant settings at the bottom of these tabs - called either "Historical utilisation definitions" (shown above) or "Forecasted utilisation definitions".
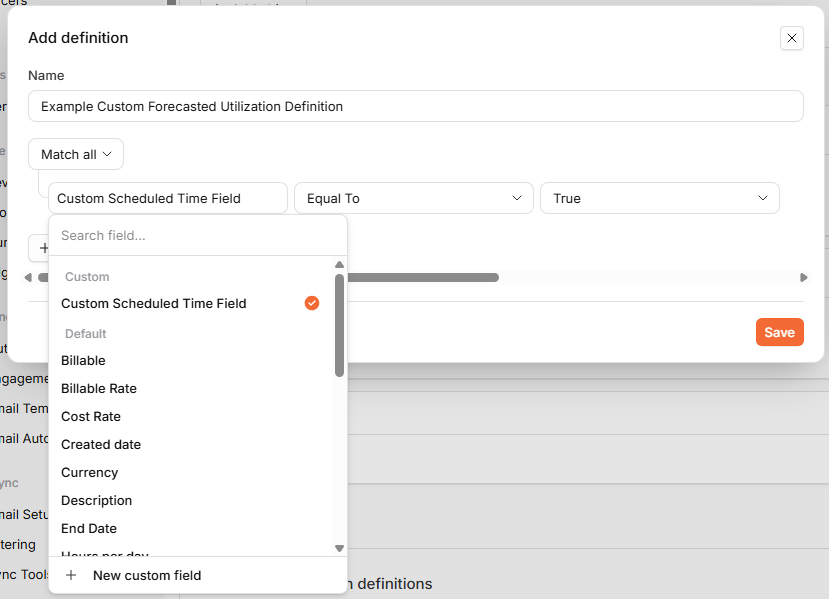
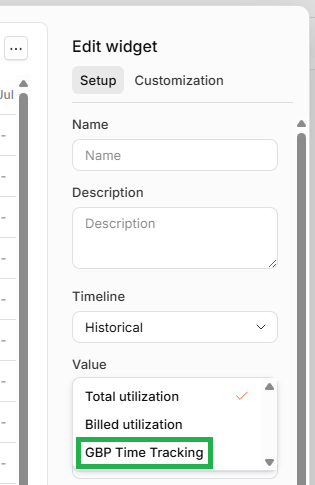
In both cases, here you click "+ Add definition", and this will open up a modal where you can define criteria (rules), based on properties (fields) on the relevant model (i.e. Time Entry or Scheduled Time). You name your definition - this will appear in the "Value" dropdown menu when you are then configuring Utilization Tables (see the second example screenshot below). You can create multiple custom definitions if desired.
Why use Utilization Tables?
Utilization Tables are especially useful for Managers who are reviewing the performance of their Team(s).
The Utilization percentage is calculated for you, and it's automatically color-coded for you to make it even easier to identify where there are potential issues - they'll be flagged for you in orange or red. You can then take action in response to that data.

Here are some typical use cases for Utilization Tables:
If a particular User keeps having a very low percentage of utilization, should they be given more work? Or, if you are looking at historical data, are they perhaps forgetting to record some of their time as Time Entries?
If a particular User keeps recording over 100% utilization, are they overworking (potentially at risk of burnout) and you should help them reduce this, e.g. by assigning upcoming new work to other Users? Or is their some inaccuracy in the inputted data?
If you have consistently low percentages across your team, are you overstaffed, or is there a Team-wide issue with colleagues not recording time spent or upcoming work not assigned?
If there's a pattern of over-utilization across the Team, do you need an additional staff member so that you can bring that utilization down to a more manageable level?
With Utilization Tables, it's easy for you to compare different Teams (which could correspond to different geographical regions, or different customer tiers, for example), so you can identify if there is a particular issue (or success) in a specific Team
How to set up a Utilization Table
The main steps are:
Choose between "Historical" (using Time Entry) and "Forecasted" (using Scheduled Time)
Choose between "Total utilization", "Billed utilization", and any custom utilization definitions you have set up in the "Settings" Global Tool
Make any changes, if required, to "Period", "Timespan" and "Offset" - the default is to plot the last 8 weeks, including the current one
Optionally, apply a filter, e.g. if you would only like to view Utilization of Users within a specific Team
Pro tips
Viewing Time Entry or Scheduled Time records
When you're viewing a Utilization Table, you can click on any of the cells to view the component Time Entries / Scheduled Time records that have contributed to that percentage.
So, for example, if you are looking at the Utilization Table below and see that Taylor has 112.5% utilization for the week starting May 25 ...
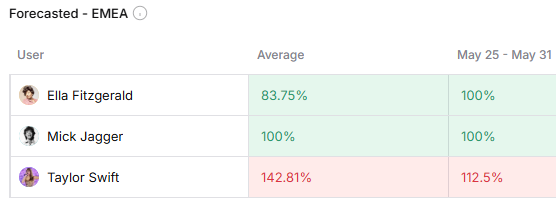
... you can click on that cell to open up the list of Time Entry records, so you can see the details, and check if anything looks obviously "wrong" (e.g. potentially entered incorrectly).
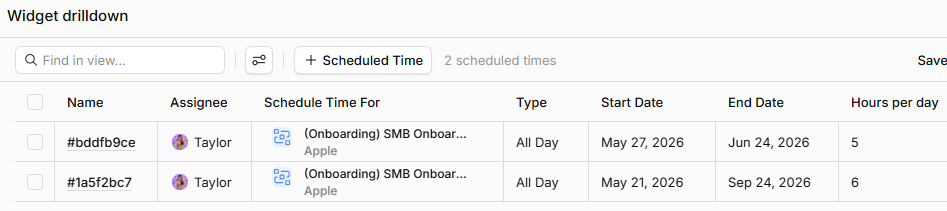
Click the image to view it enlarged
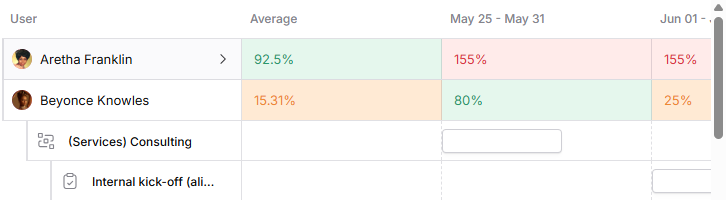
In addition, for Utilization Tables built on forecasted data (Scheduled Time), you can mouse over a User name and then click on the chevron (arrowhead) that appears, which will open up a bar or Gantt-type view
Including Utilization Tables in Pages
The first point to note is that a pre-built Utilization Table based on the "Forecasted" Timeline (and therefore Scheduled Time) is included as part of the "Resource Allocation" System Report Page, which you can read all about in our separate article here.
Click the image to view it enlarged
If you'd like to include Utilization Tables in other Dashboard or Presentation Pages (e.g. because you want to look at a Utilization Table based on "Historical" data - i.e. Time Entries), you could either:
create a Page from scratch,
or use one of our "Planhat Global Templates" (in the "Pages Library"), also known as "Community Templates" --> "Page Templates"
Once you have applied a Page Template, you can then customize it if required
The screenshots below show the two alternative methods to access the Capacity Planning / Service Delivery Page Templates.
In Content Explorer:
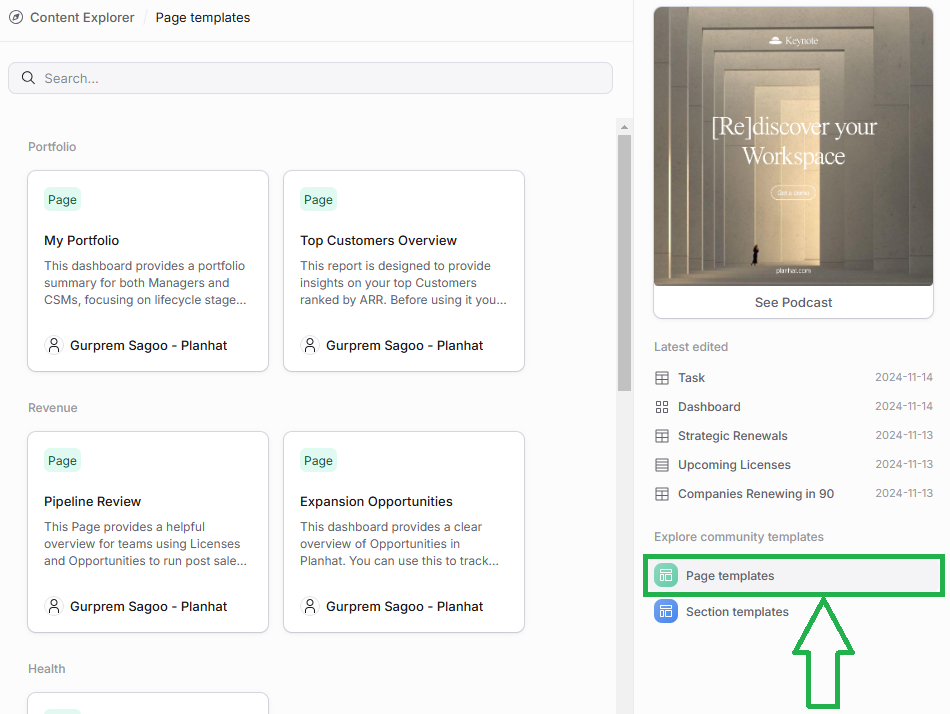
Click the image to view it enlarged
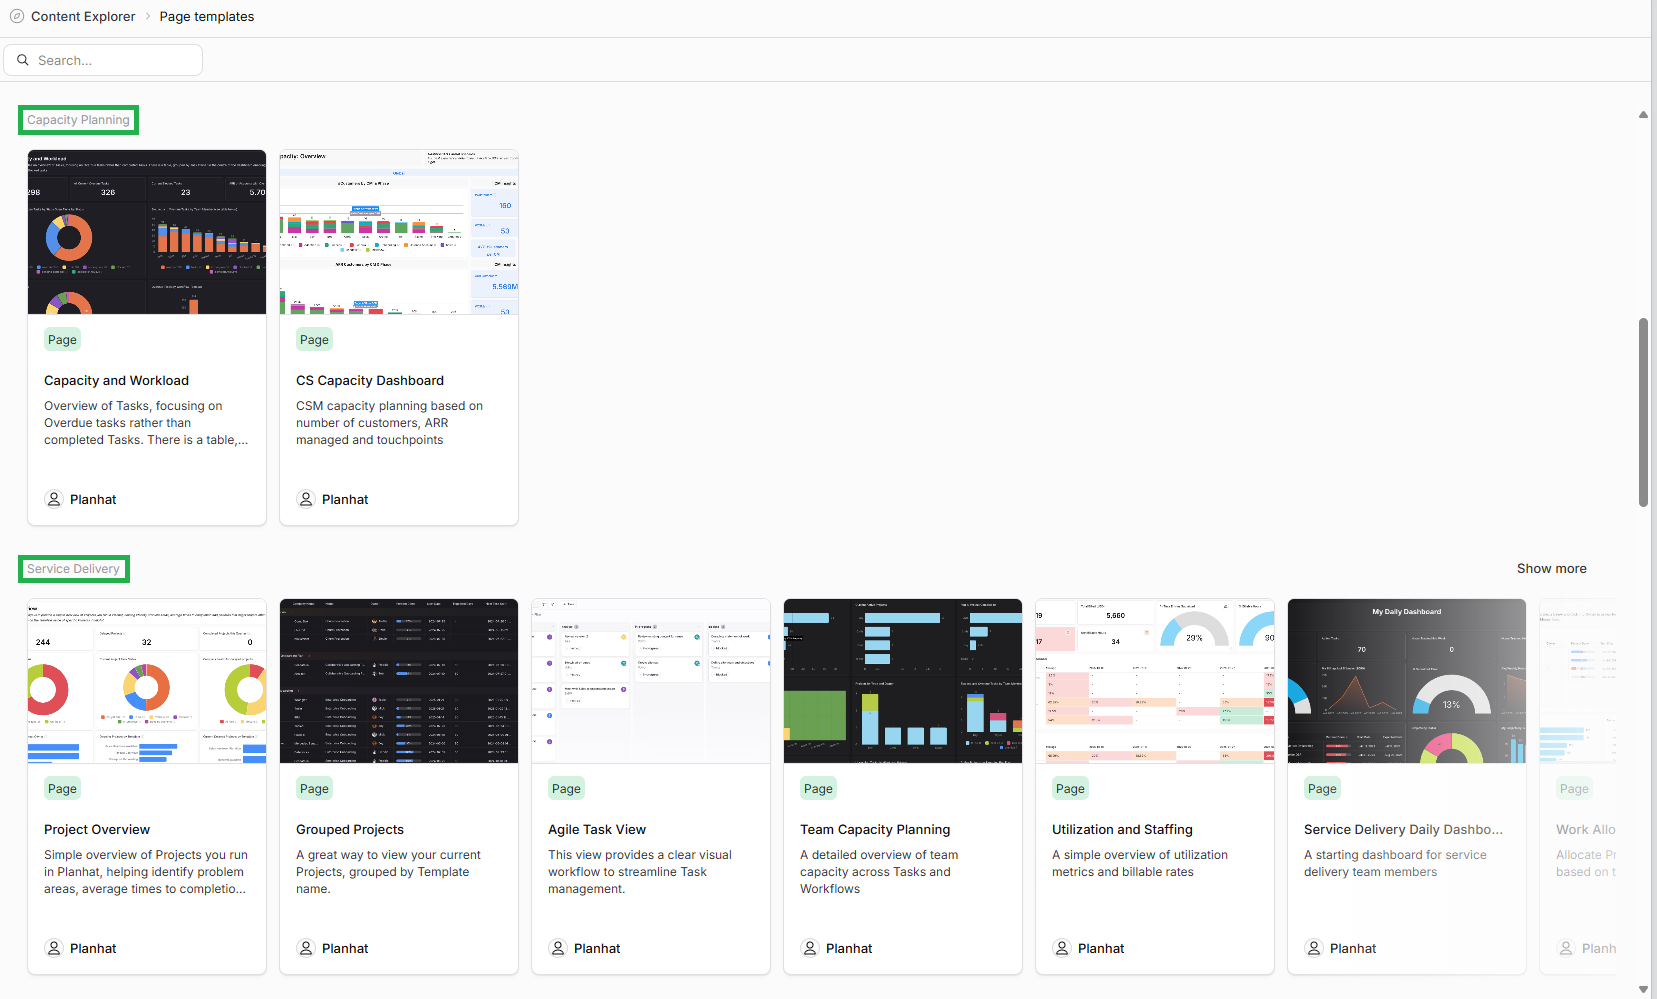
Click the image to view it enlarged
When adding a Page to a Section and selecting "Browse Planhat Global Templates"
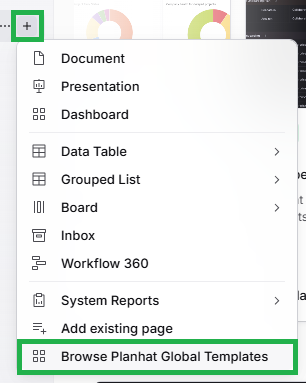
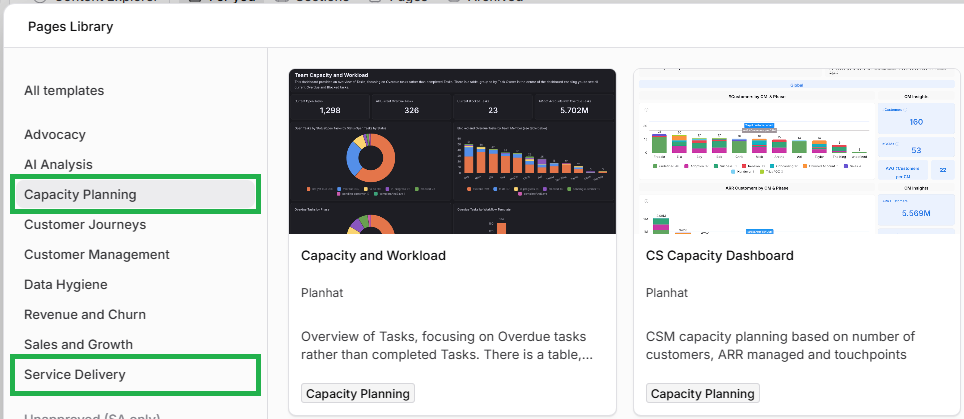
Click the image to view it enlarged
Custom colors and settings
Standard red/amber/green coloring is applied by default to cells in Utilization Tables (including in Resource Allocation Pages), helping you identify, at a glance, where there are potential problems to address. This default coloring is suitable in the majority of cases.
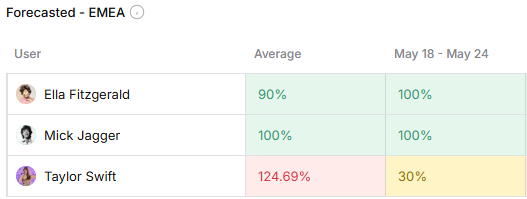
However, it is possible for you to apply your own custom colors if you like. You would define the "buckets" (value ranges) and the corresponding colors. You can do this in 2 alternative places:
In the "Settings" Global Tool, within "Services setup" - this will change the default colors for all Utilization Tables in your Planhat tenant (both historical and forecasted, and also within Resource Allocation Pages)
Within the "Customization" tab of individual Utilization Table Widgets, as we mentioned in step 3 of the instructions above
Let's take a look at "Settings". As shown in the screenshot below, you go to "Services setup" (under "Services"), and in the "General" tab you will see "Color conditions for Utilisation Widget".
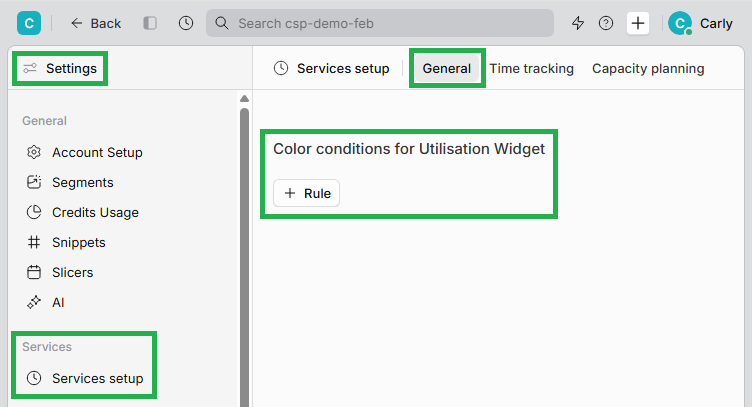
Click "+ Rule", and then start building your conditions. You specify "buckets" (value ranges) and colors.
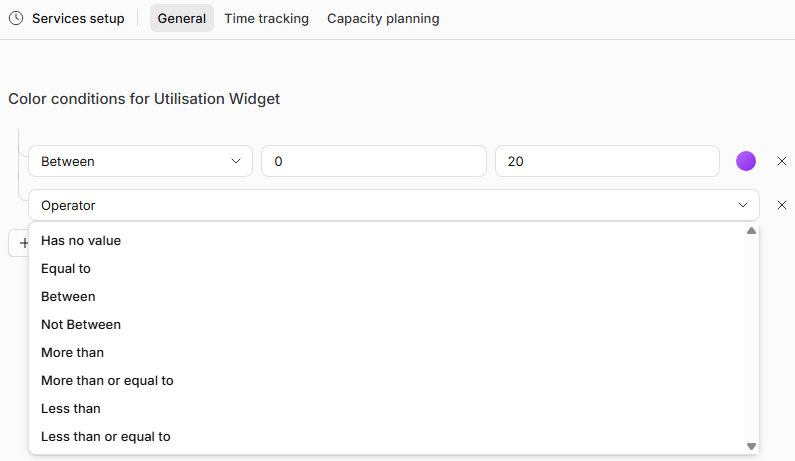
As we mentioned, if you set custom colors here, these will be the default colors for all 3 variants of Utilization Tables within your Planhat tenant:
Historical Utilization Table Widgets (using Time Entries)
Forecasted Utilization Table Widgets (using Scheduled Times)
"Resource Allocation" System Report Page (using Scheduled Times)
However, you can still set custom colors within individual Utilization Table Widgets, and they will override any defaults you set in your tenant's Settings.