Matrix Charts
Summary
Displays current snapshot or data over time? Current snapshot
Source data: Field (or metric)
Description: A specific type of live data table (grid view): choose two properties to define the rows and columns, and the relevant numerical values show in the middle where they intersect, with heatmap coloring, and sorting/limiting options
Use case example: Count of Companies, split by Owner and Phase
Who is this article for?
Planhat Users who are designing Dashboard and Presentation Pages (e.g. CS Ops)
What are Matrix Charts?
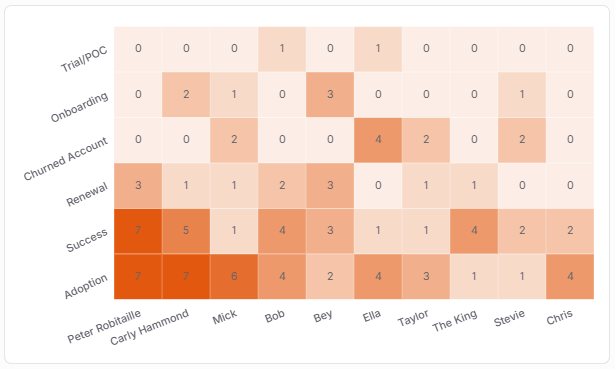
Matrix Charts are a type of "Table Widget". They are very similar to Metric Tables in that they show live numerical data in the middle of the table (e.g. count of Companies in the screenshot below), based on two properties you select to define the columns and the rows (e.g. Phase and Owner in the screenshot below).
Matrix Charts are unique in that they color cells based on the numerical values, like a heat map. You can customize the coloring, as well as the sorting of the columns and rows.
Like the other Table Widgets, Matrix Charts show a snapshot of the current data.
Why use Matrix Charts?
Matrix Charts are great if you want to look at how your choice of numerical data (e.g. count of Companies, or sum of ARR, or average CSM Score, etc.) is distributed based on your choice of two properties (qualitative categories, e.g. Owner and Phase, or Phase and Tier, or Tier and Region, and so on).
For example:
Average Company Health Score, across Pricing Plans and CSMs
Number of Products sold, by Product and Company Tier
Total ARR, by Region and Salesperson
You can choose to sort rows/columns by values, and together with the heat-map coloring, this enables easy ranking, showing what's the highest and what's the lowest, e.g. whose Companies have the highest average Health Score, and in which Phase do Companies have the highest average Health Score? Combining ranking and limiting in Matrix Charts enables you to easily see the "top X" or "bottom X" records.
The screenshot above shows an example of a Matrix Chart visualizing the count of Companies (the numbers in the middle of the table), split by Phase and Owner (the rows and columns).
This way, you can view the distribution of Companies, and identify patterns/outliers
You can easily see, for instance, whether one particular CSM has a very large number of Companies in Onboarding, a Phase that is likely to require a lot of work. If so, maybe they shouldn't be give more Companies to manage for the time being
Or does another of your CSMs have a lot of Companies in Churn Risk? That might indicate a problem - do they need some additional support/training?
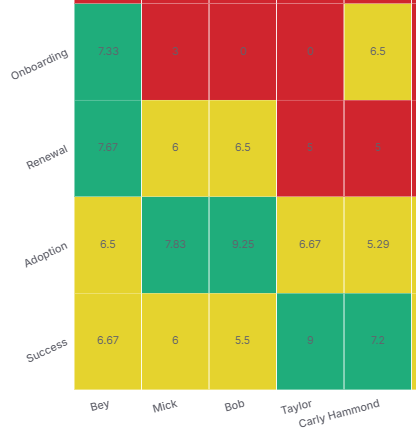
You can even configure your own color "buckets" to replace the standard heat-map coloring - e.g. using red, yellow/amber and green to rank what you consider bad, medium and good results (e.g. average CSM Scores or Health Scores) - making it even easier to categorize your data and spot successes and potential issues.
Finally, it's possible to use Matrix Charts to plot text fields with lots of values, which was formerly called "Advanced Matrix".
This means you have the ability to analyse large sets of unstructured and variable data (e.g. if you have a lot of different product variations/combinations) in a structured way
You can select custom text fields as the properties defining the columns and the rows, and the Matrix Chart can calculate and sort 50,000+ unique custom text values in each direction, displaying up to 50 columns and 50 rows
How to set up a Matrix Chart
The main steps are:
Choose a data model (object) - e.g. Company
Choose a "Value" - this will be the numbers in the middle of the table:
either "count" of records - e.g. number of Companies
or "sum", "average", "max" or "min" plus a "Property" - e.g. average of CSM Score
Choose properties to "Split by" (the rows) and "Group by" (the columns)
Optionally, choose how to sort/limit the rows and columns
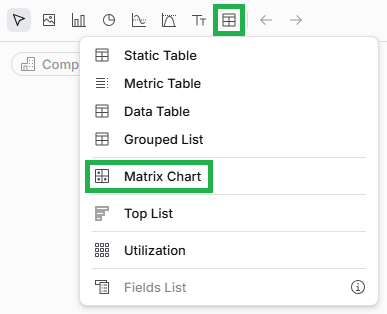
If you want to go back and edit your Matrix Chart later on, it's easy to do so. While viewing the Page in Edit mode, mouse over the Widget (Chart), and click on the pencil icon to open up the Widget setup form again.
Pro tip
As we've mentioned earlier in this article, you can use "Custom colors" in the "Customization" tab to create your own "buckets" (like custom segments) - this is great if the values in the middle of the table are considered good/medium/bad. See the screenshot below for an example.
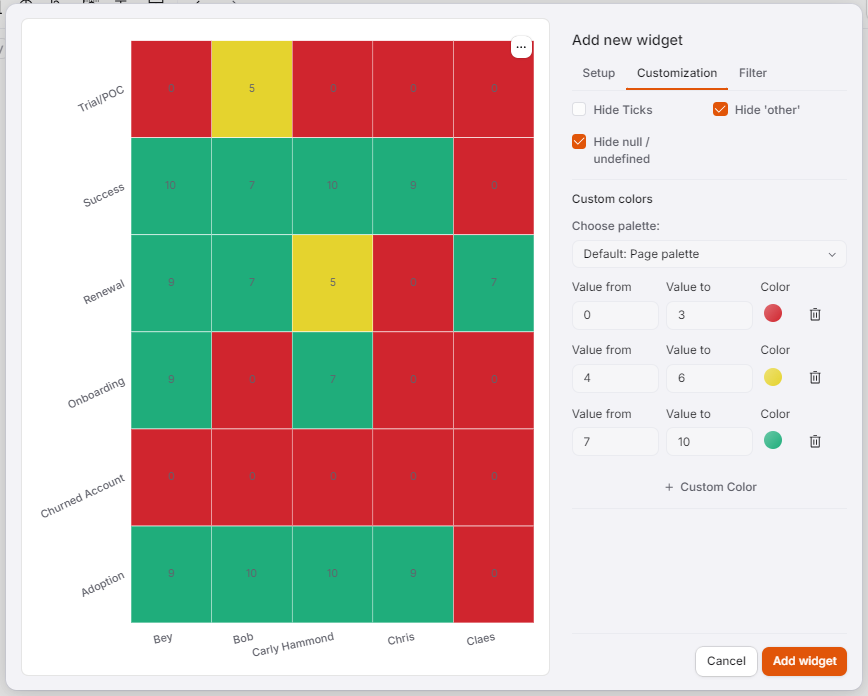
Click the image to view it enlarged
Comparison with other Widgets
Matrix Charts have a lot of similarities with Metric Tables: both are live data tables showing category properties as the columns/rows and numerical data in the middle.
Here are the key differences:
Matrix Chart | Metric Table | |
Heat map coloring | Yes | No |
Custom "bucket" coloring | Yes | No |
Custom sorting of columns and rows | Yes | No |
Ability to click on cells (values) to see further details and jump to Company Profiles | Yes | No |
Totals on column and row headers | No | Yes |
The Matrix Chart is better if you have data that you'd like to be sorted, ranked and categorized. The Metric Table may be useful if you don't want to organize the data in that way.
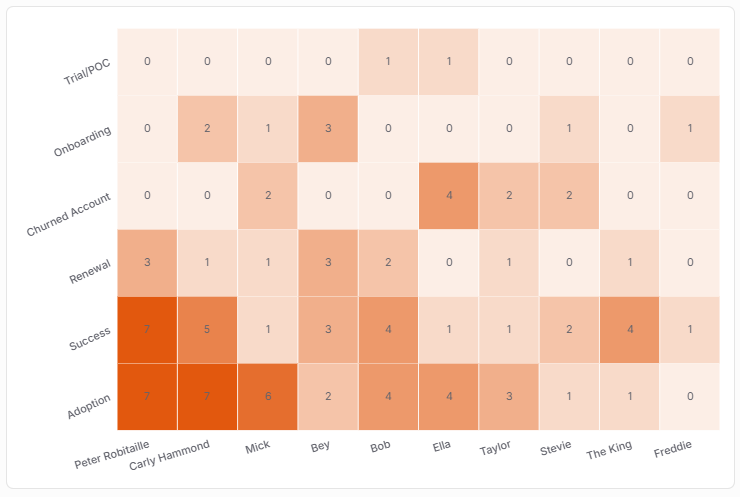
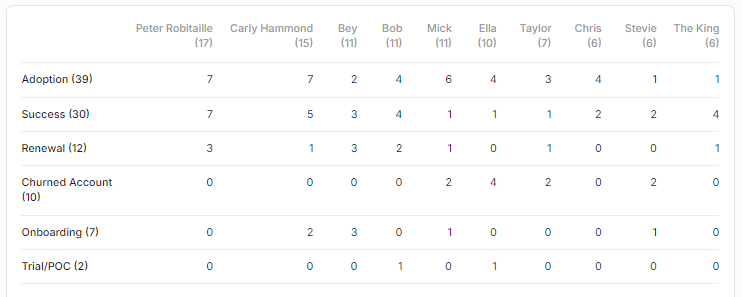
Here's the same information displayed in a Matrix Chart (top) v. a Metric Table (bottom) - a count of Companies split by Owner and Phase.
Click on the images to view them enlarged