Funnel Charts
You can use Funnel Charts to analyze sequential processes, displaying conversion rates and time spent in each step
Summary
Widget group: Trend Charts
Displays current snapshot or data over time? Data over time
Source data: Field
Description: Shows the conversion rate of records through steps in a process towards an end goal; also displays the average time spent per step
Use case example: Visualizing your sales pipeline via the Opportunity model and the Sales Stage field, so you can identify any bottlenecks etc.
Who is this article for?
All Planhat Users, for an overview of how to interpret Funnel Charts
It's particularly relevant to Planhat Users who are designing Dashboard and Presentation Pages (e.g. CS Ops)
Article contents
Introduction
Within your business, there will be many processes where a series of steps will be followed towards a specific outcome. For example:
In Sales, you'll have a pipeline: beginning with a lead, carrying out a discovery call to qualify them, performing a demo, negotiating ... with the ultimate aim signing a contract and converting that lead into a paying customer
In Customer Success, you'll want to move your customer through a series of lifecycle phases, such as Onboarding, Adoption, Success, and so on
In Support, you'll be dealing with incoming tickets, which again follow a sequence of steps, from there being an incoming enquiry in your inbox, to investigating, and ultimately resolving it
In Finance, you could be managing renewals and invoices etc., which also go through sequential processes. For example, invoices could be drafted, reviewed, approved, sent, and finally paid
... and so on
In order to effectively manage these processes, you need to visualize and analyze the progress of multiple records (e.g. Companies, or Opportunities, etc.) through the different stages. This enables you to identify potential trends/issues - such as:
Are records spending too much time in a particular stage before moving to the next one?
Is there a big drop-off in records at a specific stage, where they get to that step but then don't reach your desired end goal?
Are there any differences in process performance between different groups of records, such as regions, segments or product ranges etc.?
From this, you can make changes to enhance your processes. You'll then want to assess how the process performance (conversion rate and time per step) changes over time - e.g. if you implement a new strategy, how do the process stats look after 6 months?
The solution to all this is Funnel Charts.
Planhat's Funnel Charts enable you to track the progress of groups of records through a process. They are highly flexible, enabling you to tailor them to each of your specific processes. For example:
You can group steps (field list values) together into stages in a Funnel Chart - e.g. combining "Inbound Lead" and "Outbound Lead" options into a single "Lead" stage in your Funnel Chart
You choose how precisely the sequence steps need to be followed - for example, do you want to include records if they skip steps (e.g. if you add a record to Planhat slightly late, mid-way through the process)?
You can apply a variety of filters to view different groups of records (e.g. Company tiers), and you choose which date range to consider in the Funnel Chart
In this article, we'll take you through Funnel Charts in further detail - what they are, why they are useful, and how to set them up.
What are Funnel Charts?
Funnel Charts are used to plot the progress of multiple records (e.g. Opportunities or Companies, etc.) through a sequential process ...
... tracked via a specific list field (e.g. Sales Stage on the Opportunity model, or Phase on the Company model - where each step is recorded as a list field value) ...
... where the process has an end goal (also recorded in a field value, such as when an Opportunity is Closed Won, or a Company reaches the Success Phase).
Funnel Charts help you get an overview of the process, so you can assess things like whether there are bottlenecks at different stages, or whether there are differences in conversion rates between different groups of records (e.g. regions), etc. We describe use cases in further detail next in this article.
Planhat's Funnel Charts are highly flexible compared to similar charts you may see in other tools - there are a wide variety of customization options available, so you can easily personalize each Funnel Chart to make it suit your specific process. We explain these options later in this article.
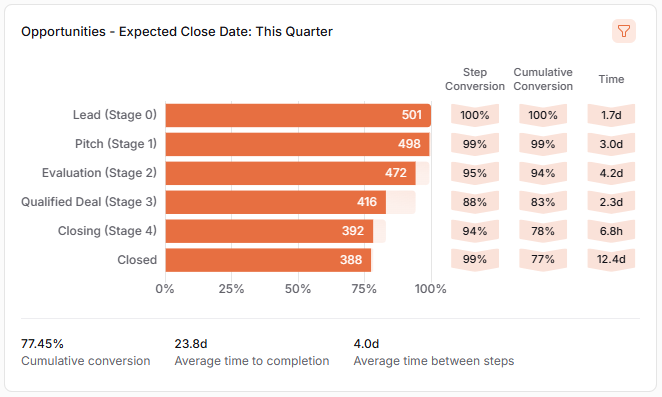
Click the image to view it enlarged
Technical details
Funnel Charts are a type of "Trend Chart" (Widgets that plot data over time) that you can include in Dashboard and Presentation Pages.
To describe/explain a Funnel Chart, with reference to the example screenshot above:
The horizontal bars correspond to the steps/stages in the process (which you configure, and represent records with one or more specific list field values)
The totals in the right of the bars is the count of records (e.g. number of Opportunities)
In the "Step Conversion" column, you can follow the percentage of records in each step that have moved to the next step
So, for example, referring to the bottom value of the "Step Conversion" column in the screenshot above, that's been calculated by 388 records in the Closed stage, divided by 392 records in the Closing (previous) stage, expressed as a percentage, making 99%
Because this looks specifically at conversion between adjacent steps, when you read down the column, you may see percentages decrease or increase, like in the example screenshot above
In the "Cumulative Conversion" column, you can follow the percentage of records starting the process that made their way to each stage
So, for example, referring to the bottom value of the "Cumulative Conversion" column in the screenshot above, that's been calculated by 388 records in the Closed stage, divided by 501 records in the first stage ("Lead (Stage 0)"), expressed as a percentage, making 77%
This value - corresponding to the proportion of records from the first step that have reached the last step - is displayed (just with additional decimal places) in the "Cumulative conversion" KPI at the bottom left of the Funnel Chart
The "Time" column shows the average time records spend in each stage. "h" is hours and "d" is days, and so on
Considering the date range of data displayed in a Funnel Widget:
The Funnel Chart is looking at when the field in question (that the particular Funnel Chart is built on, such as Sales Stage on the Opportunity model) changed value for each record
When configuring a Funnel Chart (details below), you configure the time period to be included
Funnel Charts can only look back to 1st January 2024, or up to 3 years, whichever is soonest
📌 Important to note
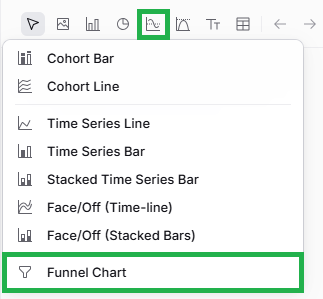
At time of writing, Funnel Charts are not available as default in every Planhat tenant. The ability to use Funnel Charts is controlled via on a per-tenant level via a "feature flag" within the "Admin Settings" in the "Settings" Global Tool, which is only accessible to Planhat "Super Admins" (i.e. Planhat staff members). If you don't see "Funnel Chart" as an option within the Trend Charts group (see screenshot below), please reach out to your CSM/TAM to discuss.
Why use Funnel Charts?
Funnel Charts are part of the "Trend Charts" category of Widgets: they are used to visualize and analyze data over time.
Specifically, Funnel Charts are perfect for tracking a sequential process involving multiple records of a specific data model (e.g. Opportunities, or Companies), tracked via a particular list field on that model (e.g. for Opportunities, it could be the Sales Stage system field).
There are a wide variety of possible use cases, but some typical examples are:
Sales pipeline - track how Opportunities (deals) progress through Sales Stages (Lead, Pitch, Evaluation, and so on)
Customer Success lifecycle - track how Companies progress through Phases (e.g. Pre-Onboarding, Onboarding, Adoption, etc.)
Support tickets - track how tickets (a type of Conversation) progress through different Status values (e.g. New, Investigating, Resolved etc.), to analyze ticket turnaround/resolution times
Finance/Operations, e.g. Invoices - track financial data such as the progress of Invoices via the Status field
And more - remember, Funnel Charts are great for any sequential process (i.e. where a record goes through a series of steps) where the steps are recorded as values in a single list field
Using Funnel Charts, you can assess:
What's the conversion rate between stages? Are there any bottlenecks? For example:
Are you struggling to convert Opportunities (deals) between particular stages?
Are Invoices getting stuck in the Review stage?
Are Companies spending too long in Onboarding?
Etc.
How does the progress of records through the process vary between different groups of records? To give practical examples:
Are the EMEA Sales team experiencing bottlenecks in their deal conversion that the Americas Sales team are not?
Does progress through Company lifecycle stages vary depending on different groups of Companies (e.g. SMB Companies v. Enterprise Companies)?
Are support tickets for Product A being resolved a lot more quickly than tickets for Product B?
And so on
Identifying these potential issues means you can determine causes and address them. You can then view and compare the Funnel Chart data over different time periods (e.g. using a Slicer), to see if your interventions are having the desired effect.
How to set up a Funnel Chart
The main steps are:
Choose a data model (object) - e.g. Company, or Opportunity
Choose a list field to build the Funnel Chart on - e.g. Company Phase, or Opportunity Sales Stage
Define the time period of data that the Funnel Chart will include - either a manual timespan, or a Slicer
Ensure you have all the process stages listed correctly and in the right order
📌 Important to note
The first time you create a Funnel Widget, it may take a little while to load, as complex queries on large datasets are happening "under the hood", but subsequent builds will be even quicker.
There is a daily calculation per tenant, plus Widgets are recalculated when you view the Page in Edit or Explore mode.
Pro tips
Planhat's Funnel Charts are super flexible - like many aspects of Planhat, they can be personalized to suit your specific use-case needs.
We've already covered some customization tips within the detailed instructions above, but here we highlight and summarize a couple of key points:
You decide whether all steps need to be completed, and in the right order, for a record to be included in the Funnel Chart
You set this via a checkbox in the "Customization" tab
Example use cases:
Think about whether there are cases where a record may follow a slightly different order of steps, or potentially skip steps
It may be that sometimes an Opportunity is added to your Planhat at a later stage, when it's already at "Investigation" rather than "Lead"
You can group different list values together as a single stage (row/bar)
You set this via the "Custom Segments" section within the "Customization" tab (described in the instructions above)
This is great if your process structure (with reference to the field list values) is not purely sequential - e.g. maybe there's one stage in the process where records can take different potential values
Example use case: if your Funnel Chart is based on the Sales Stage field on the Opportunity model, you might have "Inbound Lead" and "Outbound Lead" list values, but want to combine them as a single "Lead" stage in the process