Top List Bar Charts
Summary
Displays current snapshot or data over time? Current snapshot
Source data: Field (or metric)
Description: Like a Vertical Single Bar Chart but more specific: shows "top x" (or "bottom x") records, like a Top List Table
Use case example: Top 5 Companies by ARR
Who is this article for?
Planhat Users who are designing Dashboard and Presentation Pages (e.g. CS Ops)
What are Top List Bar Charts?
Top List Bar Charts are part of the simple/basic "Bar Chart" Widget group - these are bar charts that show a snapshot of current data (as opposed to bar charts within the "Trend Charts" group, which show data over time).
Top List Bar Charts are the simplest form of Bar Chart, designed specifically to show the "top x" (or "bottom x") records of a model, sorted by your choice of property - e.g. top 5 Companies by ARR, as shown in the example below.
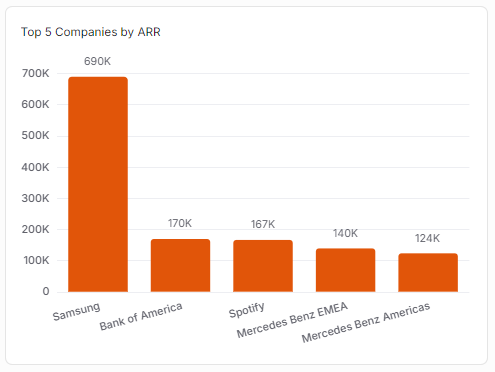
If you wanted to display the "top x" (or "bottom x") in a table form, you could use a Top List Table rather than a Top List Bar Chart.
Why use Top List Bar Charts?
Top List Bar Charts are a quick, concise way to rank records (e.g. Companies) based on a single property.
For example:
Top 10 Companies by ARR
Top 20 End Users by Total Beats
Top 5 Licenses by MRR
... you get the idea! These help you identify the "most important" records of a model.
Although the default is to rank in descending order, making a "top list" like the name, it's also possible to sort the data in ascending order, effectively making a "bottom list" instead. This could be useful to visualize data such as:
Companies ranked by "Renewal (in days)" in descending order, meaning that the Companies who will renew the soonest (or who are the most overdue!) will be the ones displayed
End Users ranked by "Courses completed last 30 days" (or your choice of Calculated Metric related to usage) so you can see who hasn't been using your product
... this can be used to help you decide where you should focus your attention.
How to set up a Top List Bar Chart
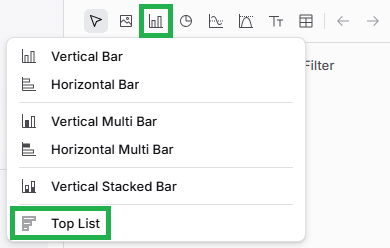
The main steps are:
Choose a data model (object) - e.g. Company
Choose a "Property" on that data model to rank by - e.g. ARR
Choose a number to limit results by - e.g. 5 (for the top 5)
If you want to go back and edit your Top List Bar Chart later on, it's easy to do so. While viewing the Page in Edit mode, mouse over the Widget (Chart), and click on the pencil icon to open up the Widget setup form again.
Pro tips
As we have mentioned elsewhere in this article, you can use the "Sort ascending" checkbox in the "Customization" tab to turn your Top List Bar Chart into a "bottom list bar chart" instead. This is great for a variety of use cases where you want to highlight records (e.g. Companies or End Users) with the lowest values for a property, rather than the highest values - e.g. when the renewal is the fewest number of days away
Remember you can add a "Reference Value" in the "Customization" tab, which can be handy for benchmarking/targets - you can see an example in the screenshot above
Comparison with other Widgets
Top List Bar Charts are most closely related to Top List Tables and Vertical Bar Charts.
Top List Table
Here's the same data displayed in a Top List Table and a Top List Bar Chart.
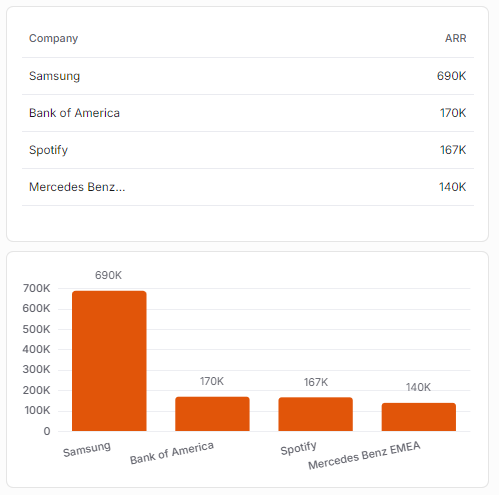
The Top List Bar Chart has the advantage that it makes relative sizes more obvious to see - e.g. it's easier to see in the Top List Bar Chart above that the top Company, Samsung, has a much bigger ARR than the next three highest Companies, who all have similar ARR.
The Top List Table has the advantage that you can display additional properties as references (additional columns) if you like (example shown here), great for additional context, and this isn't possible in a Top List Bar Chart. Top List Bar Charts can display reference values (horizontal lines; example shown here), which is good for targets, and that isn't possible in a Top List Table.
Vertical Bar Chart
Here's the same data displayed in a Top List Bar Chart (top) and a Vertical Bar Chart (bottom).
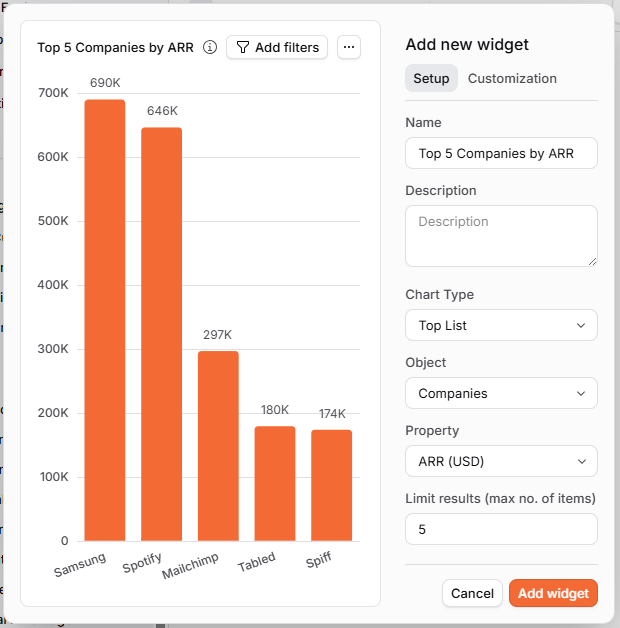
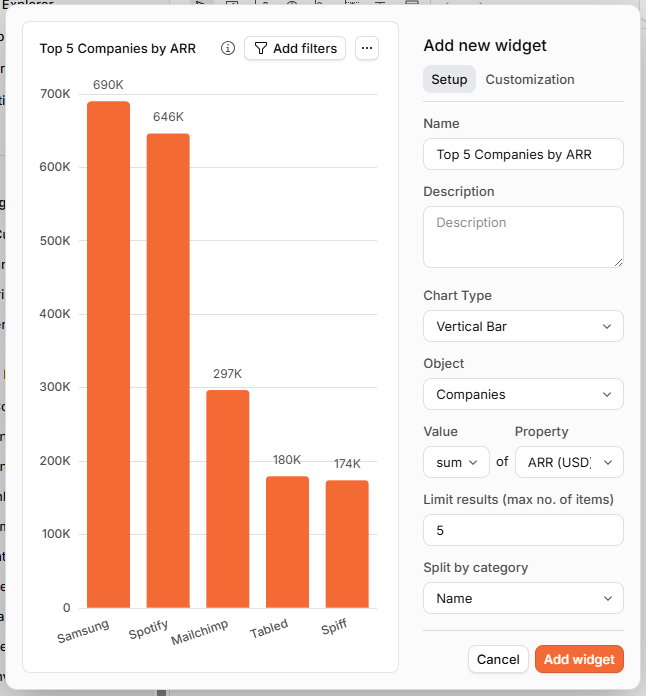
As you can see, the actual charts end up exactly the same, but the Vertical Bar Chart has a little more configuration to set up to achieve that result.
Vertical Bar Charts are a lot more flexible and can be used for a wider variety of use cases, so that's their strength over the Top List Bar Chart, but for the specific use case of displaying the "top x" records when considering sum totals, Top List Bar Charts are a shortcut to create this specific display of data a little more quickly and easily.