Vertical and Horizontal Single Bar Charts
Summary
Displays current snapshot or data over time? Current snapshot
Source data: Field (or metric)
Description: Simple single bar chart - qualitative (category) property defining the x axis for Vertical Bar Charts or y axis for Horizontal Bar Charts
Use case example: Count of Companies, split by Owner
Who is this article for?
Planhat Users who are designing Dashboard and Presentation Pages (e.g. CS Ops)
What are Vertical and Horizontal Single Bar Charts?
We bet you're already familiar with the concept of bar charts! 📊 There are actually many different types of bar charts available for you when creating Dashboard or Presentation Pages in Planhat, and in this article we are focusing on the specific types called "Vertical Bar" and "Horizontal Bar" that are part of the "Bar Charts" Widget group.
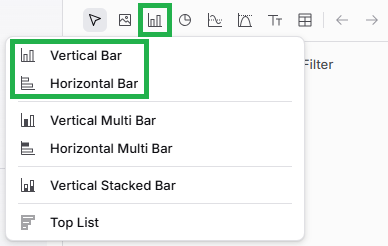
The "Bar Charts" Widget group consists of simple bar charts that show a snapshot of current data (as opposed to bar charts within the "Trend Charts" group, which show data over time).
Vertical Bar Charts and Horizontal Bar Charts are functionally exactly the same - the bars just run vertically or horizontally, as the names indicate! The screenshot below shows an example of the same data displayed in the two chart types.
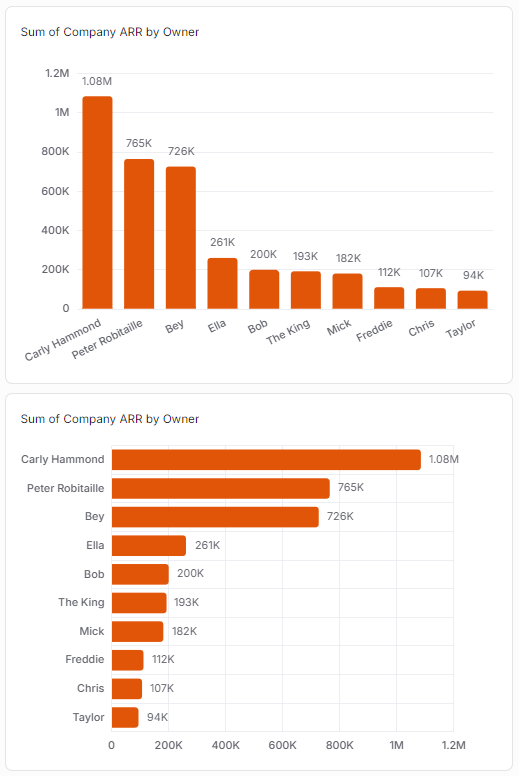
As you can see in the example above, Vertical and Horizontal Bar Charts have a numerical (quantitative) axis, and qualitative category values on the other axis. Changing between Vertical and Horizontal Bars flips what is on the x-axis and what is on the y-axis.
You have flexibility in what's represented by the quantitative (numerical) axis - this can be a count of records (e.g. number of Companies), or sum/average/max/min of a property.
Why use Vertical and Horizontal Bar Charts?
Vertical Bars and Horizontal Bars are easy to set up and understand, but can be customized in various ways to best suit each individual use case.
Use cases include (number axis / category axis):
Count of Companies / Phase
Count of Companies / Health Score
Count of Conversations / Type
Average Company Health Score / Owner
Sum of Company ARR / Tier
Sum of Invoice Amount / Status
You can even define your own custom "buckets" if you want to group particular qualitative category values together - e.g. plotting low/medium/high Health Scores (3 bars) rather than a bar for every possible value. More on this in step 3 of the instructions below.
How to set up a Vertical or Horizontal Bar Chart
The main steps are:
Choose a data model (object) - e.g. Company
Define one axis (the numerical axis) by choosing between:
Either counting the number of records - e.g. number of Companies
Or a property (from a choice of metrics and fields) plus an operation (sum, average, max or min) - e.g. sum of ARR
Define the other axis (the bars) by choosing a category property - e.g. Company Phase
If you want to go back and edit your Bar Chart later on, it's easy to do so. While viewing the Page in Edit mode, mouse over the Widget (Chart), and click on the pencil icon to open up the Widget setup form again.
Pro tips
As we have mentioned elsewhere in this article:
You can configure "Custom Segments" (custom bars) if you'd like to group certain category values (bars) in together, with your choice of labels (names) and colors - using this for Health Scores (as shown in the screenshot above) is a typical use case
You can add a "Reference Value", which can be handy for benchmarking/targets - you can see an example in a screenshot earlier in this article
Comparison with other Widgets
Vertical Bar Charts are similar to Top List Bar Charts. Here's the same data displayed in a Top List Bar Chart (shown at the top) and a Vertical Bar Chart (shown at the bottom).
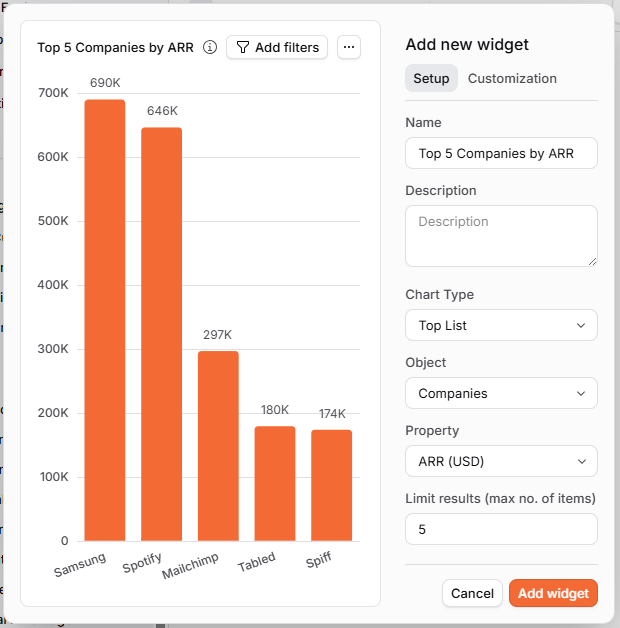
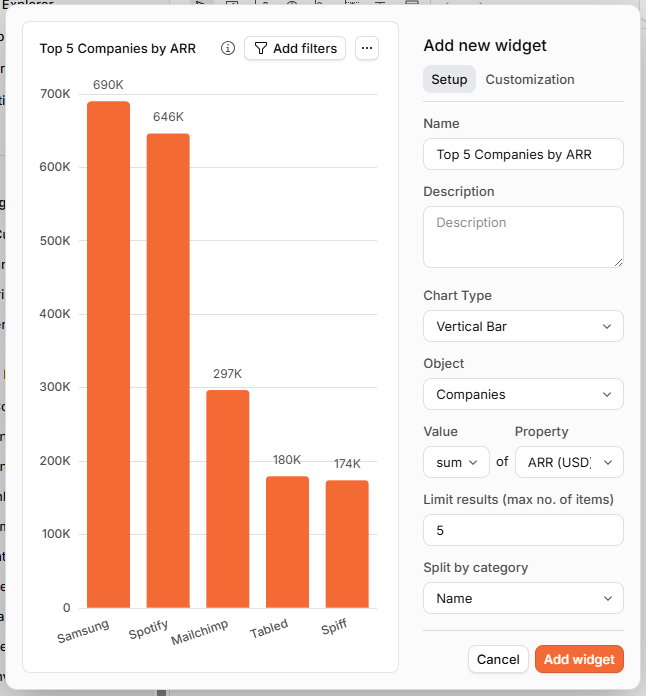
As you can see, the actual charts end up exactly the same, but the Vertical Bar Chart has a little more configuration to set up to achieve that result.
Vertical Bar Charts are a lot more flexible and can be used for a wider variety of use cases, so that's their strength over the Top List Bar Chart - often you'll need a Vertical Bar Chart because you want a display of data that isn't possible in a Top List Bar Chart.
However, for the specific use case of displaying the "top x" records when considering sum totals, Top List Bar Charts are a shortcut to create this specific display of data a little more quickly and easily.