KPI Widgets
Summary
Widget group: Text Widgets
Displays current snapshot or data over time? Current snapshot
Source data: Field (or metric)
Description: Shows a single number - live numerical data
Use case example: Sum of ARR
Who is this article for?
Planhat Users who are designing Dashboard and Presentation Pages (e.g. CS Ops)
What are KPI widgets?
KPI widgets are a type of Text Widget, each displaying a single live data point: a snapshot of right now.
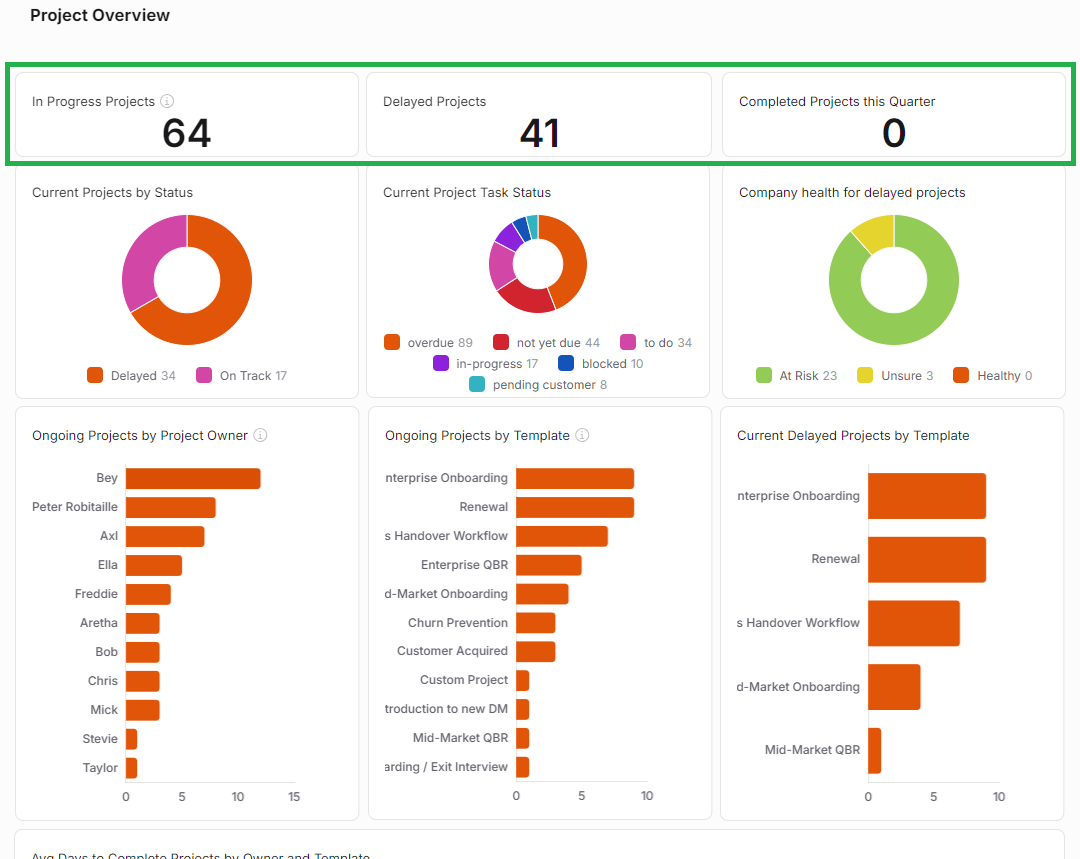
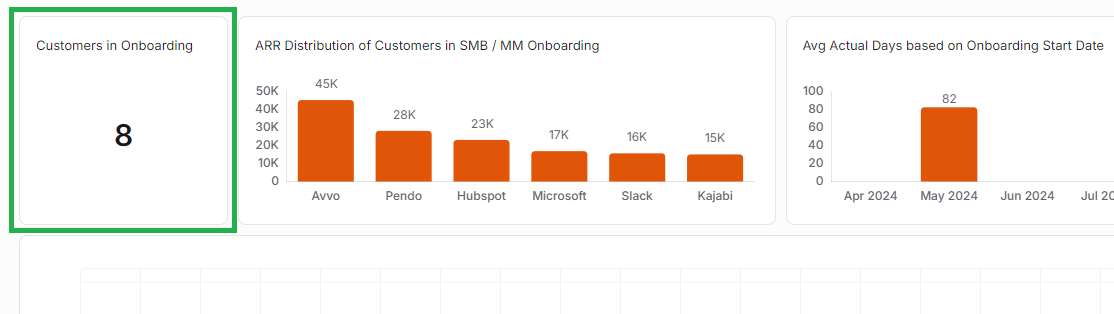
Here's a couple of examples of KPI Widgets (ringed in green) in Dashboard Pages.
Click the images to view them enlarged
Why use KPI Widgets?
KPI Widgets are great "headline" Widgets - they are typically used near the top of a Dashboard Page to display key values that can be quickly understood.
KPI Widgets carry out simple mathematics for you - they can count the number of records of your choice of model, or calculate the sum or average of your choice of property (field or metric).
Typical examples are:
Sum of Company ARR
Average Company Health Score
Count of Companies
This works particularly well in combination with Widget-specific filters (described in the instructions below). For example, you could make a series of KPI Widgets (using copy/paste to save time) for different Company segments - e.g. total ARR of Gold Accounts in one KPI Widget, total ARR of Silver Accounts in another KPI Widget, and total ARR of Bronze Accounts in another.
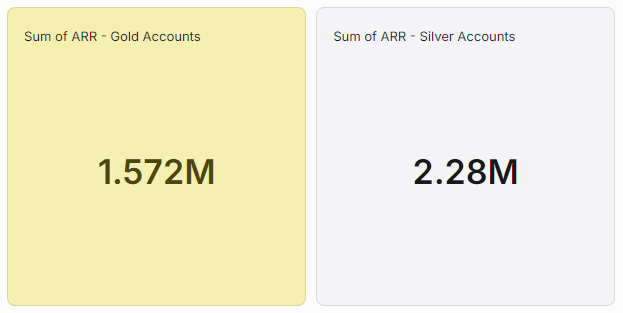
The possibilities are almost endless! Here at Planhat, we use KPI Widgets within our Enablement Dashboard to display the total number of students who have enrolled and completed specific training courses, for instance.
How to set up a KPI Widget
The main steps are:
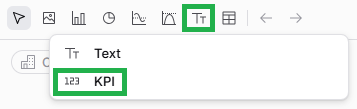
Choose a data model (object) - e.g. Company
Choose either:
To count the number of records (e.g. number of Companies)
Or pick another operation and a property (e.g. sum of Company ARR)
If you want to go back and edit your KPI Widget later on, it's easy to do so. While viewing the Page in Edit mode, mouse over the Widget, and click on the pencil icon to open up the Widget setup form again.
Pro tips
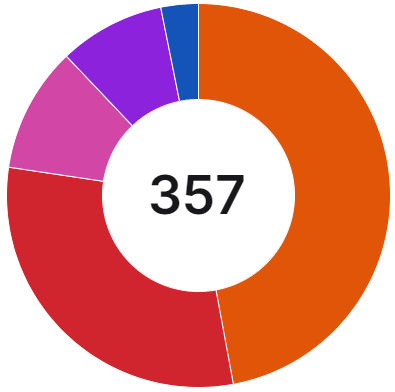
Comparison with other Widgets
KPI Widgets are fairly unique in that they display a single value.
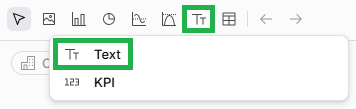
There are also basic Text Widgets within the "Text Widgets" group, but these do not calculate/display live data like KPI Widgets. They are used in Pages for simple titles and instructions etc.
If you would like to display a percentage share rather than an absolute value, e.g. if you're working towards a target, then you may wish to consider using a Gauge Chart rather than a KPI Widget. For example, a Gauge Chart could show the percentage of Companies with a high Health Score, rather than a KPI Widget showing the number of Companies with a high Health Score.