Vertical and Horizontal Multi Bar Charts
Summary
Displays current snapshot or data over time? Current snapshot
Source data: Field (or metric)
Description: Like a Vertical/Horizontal Single Bar but with an additional qualitative (category) property defining bars, so you have clusters of bars
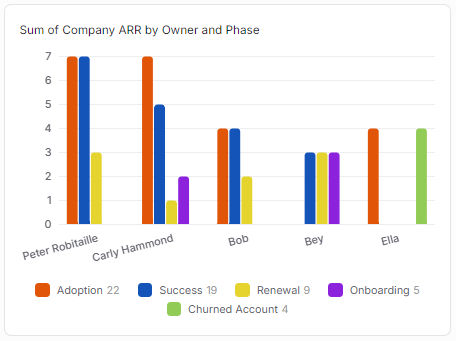
Use case example: Count of Companies, split by Owner and Phase
Who is this article for?
Planhat Users who are designing Dashboard and Presentation Pages (e.g. CS Ops)
What are Vertical and Horizontal Multi Bar Charts?
"Vertical Multi Bar" and "Horizontal Multi Bar" are part of the "Bar Charts" group, all of which show a snapshot of current data (as opposed to bar charts within the "Trend Charts" group, which show data over time).
They are similar to the "Vertical Bar" and "Horizontal Bar" Single Bar Charts, with one quantitative (numerical) axis and one qualitative (category) axis - but you add in an additional qualitative property to further divide/categorize the data, to add extra context.
What do we mean by this? For example:
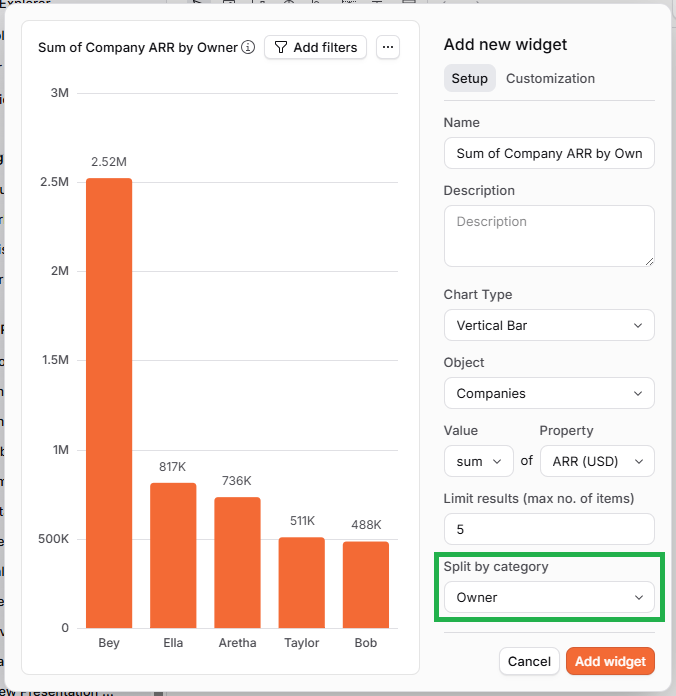
If the Single Bar chart is:
Sum of Company ARR / Owner
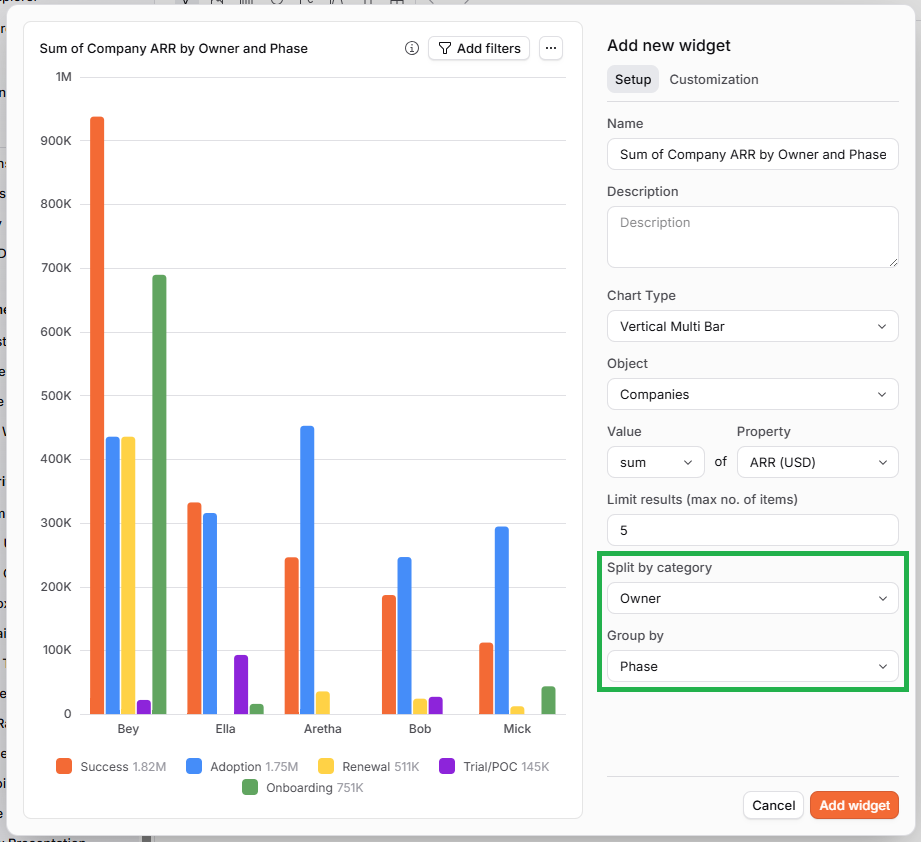
Then the Multi Bar chart could be:
Sum of Company ARR / Owner / Phase
These are shown below - click the images to view them enlarged.
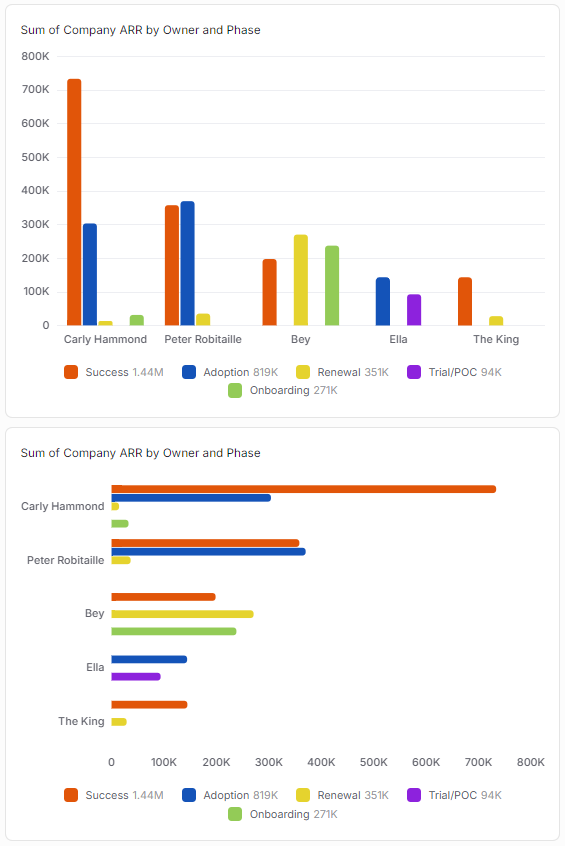
Vertical Multi Bar Charts and Horizontal Multi Bar Charts are functionally exactly the same - the bars just run vertically or horizontally, as the names indicate! The qualitative/quantitative axes swap places. The screenshot below shows an example of the same data displayed in these two chart types.
Like Single Bar Charts, you have flexibility in what's represented by the quantitative (numerical) axis - this can be a count of records (e.g. number of Companies), or sum/average/max/min of a property.
Why use Vertical and Horizontal Multi Bar Charts?
As we mentioned above, Multi Bar Chart use cases are like the use cases for Single Bar Charts (analyzing numerical data in relation to category values), but with an additional category property further dividing the data. They therefore actually have similar use cases to Matrix Charts and Metric Tables - it's just that they display the data graphically rather than by written numbers.
For example:
Average Company Health Score, by Owner and Phase
Count of Companies, by Owner and Phase
Total ARR, by Region and Salesperson
Like with Matrix Charts and Metric Tables, Multi Bar Charts enable you to see the relationship between the properties. For instance, if a particular CSM is assigned to a very high number of Companies in Onboarding, their workload is likely high, so don't assign them more Companies to manage; or if a specific CSM has a lot of their Companies marked as Churn Risk, then this may need to be investigated, and perhaps they need some extra support/training.
How to set up a Vertical or Horizontal Bar Chart
The main steps are:
Choose a data model (object) - e.g. Company
Define one axis (the numerical axis) by choosing between:
Either counting the number of records - e.g. number of Companies
Or a property (from a choice of metrics and fields) plus an operation (sum, average, max or min) - e.g. sum of ARR
Define the other axis by choosing a category property - e.g. Company Phase
Choose another category property to define the individual bars
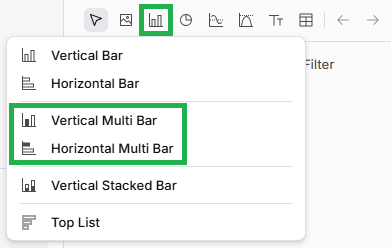
If you want to go back and edit your Multi Bar Chart later on, it's easy to do so. While viewing the Page in Edit mode, mouse over the Widget (Chart), and click on the pencil icon to open up the Widget setup form again.
Pro tips
As we have mentioned elsewhere in this article:
You can configure "Custom Segments" (custom bars) if you'd like to group certain category values (bars) in together, with your choice of labels (names) and colors
You can add a "Reference Value", which can be handy for benchmarking/targets
You can convert your Multi Bar Chart into a percentage-based Stacked Bar Chart
Remember that "Split by category" defines the main groups on the qualitative/category axis, and "Group by" defines the bars within those groups. When you know the two qualitative/category properties you want to plot, try experimenting with swapping between which is "Split by category" and which is "Group by" - for example:
Click the images to view them enlarged
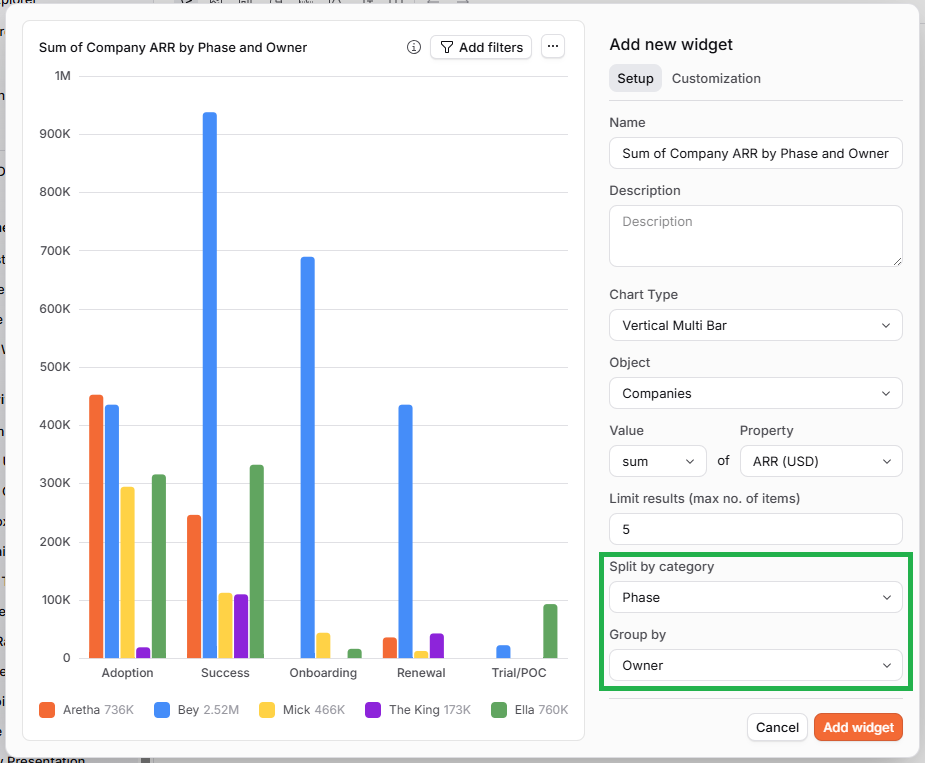
Note that you can't select the same property to be both "Split by" and "Group by" at the same time, so if you would like to swap the properties over like in the example above, you first need to deselect one (by selecting "-" in the dropdown list) before you can select it in the other dropdown.
Comparison with other Widgets
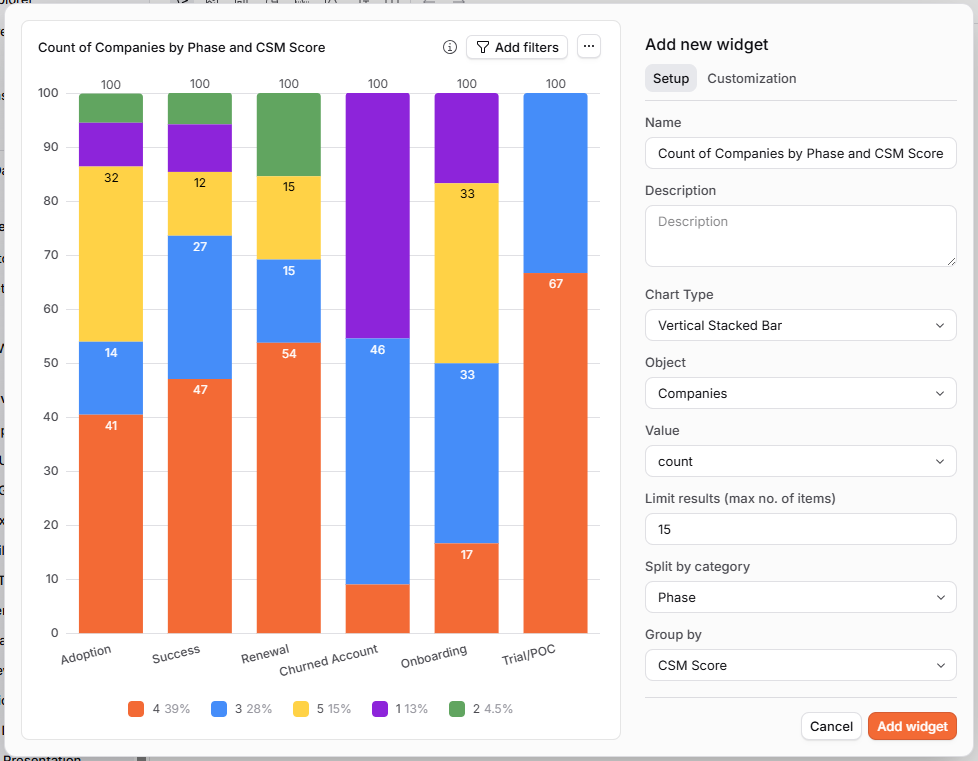
Vertical Multi Bar Charts have a lot of similarities with Vertical Stacked Bar Charts - the functionality, use cases, and method to configure the charts are basically the same. The only difference is that rather than the additional property corresponding to individual bars, in a Stacked Bar Chart they are segments of the same bar. This means that:
Stacked Bar Charts are perfect for showing the total of the whole category (axis property)
This means they are great for plotting "count" or "sum" data
Multi Bar Charts are better when you want to see relative sizes
This means they can also be good for showing "average", "max" or "min"
Here's the same data displayed in a Vertical Multi Bar Chart (at the top), a standard Vertical Stacked Bar Chart (in the middle), and a percentage-based Vertical Stacked Bar Chart (at the bottom). You can see the same configuration in the settings on the right of each image.
Click the images to view them enlarged
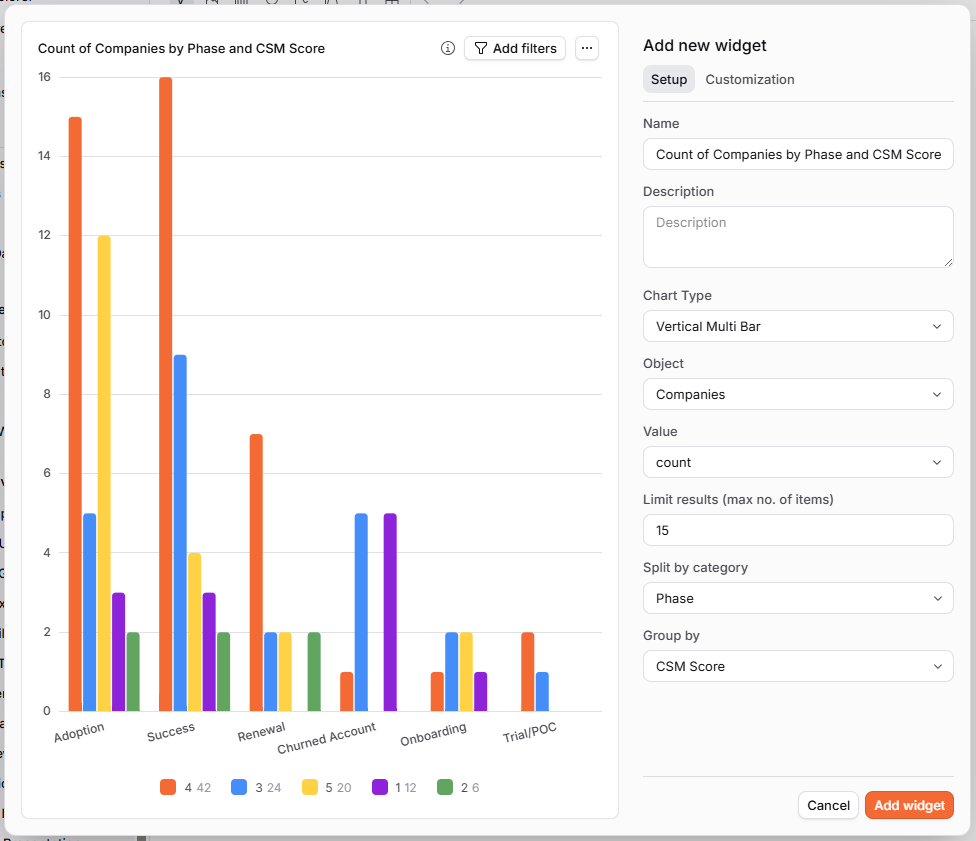
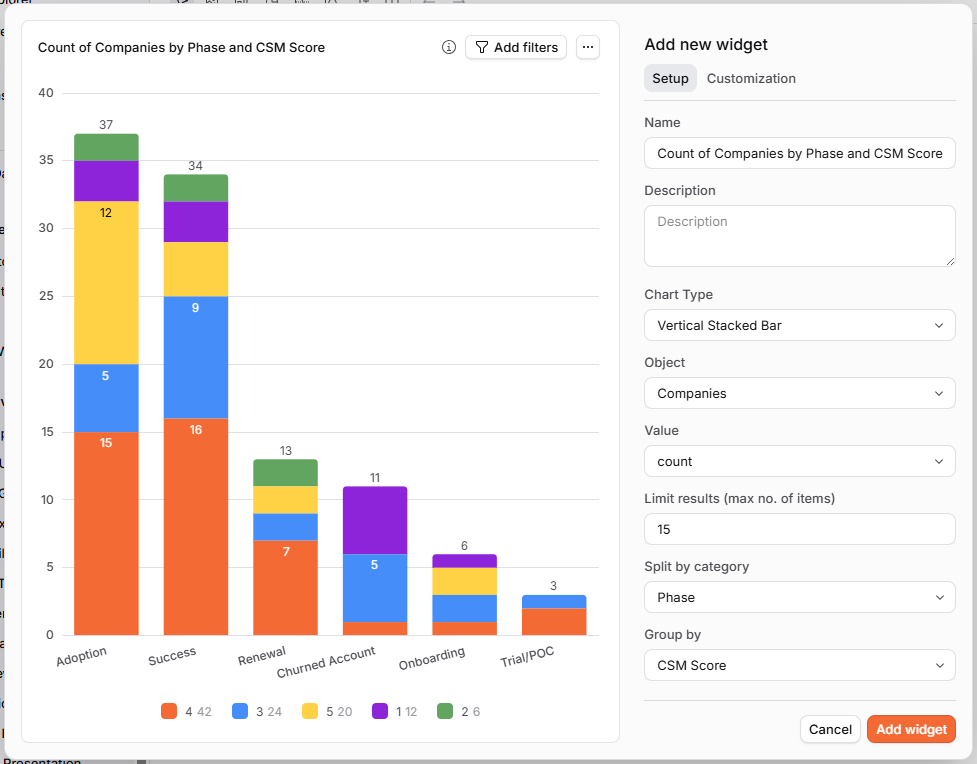
If you specifically want a horizontal bar chart, it's not possible to add a "Horizontal Stacked Bar" - although you can create a "Horizontal Multi Bar" and then select the "100% stacked bar" checkbox to turn it into a horizonal percentage stacked bar.