Pie and Doughnut Charts
Summary
Widget group: Share Charts
Displays current snapshot or data over time? Current snapshot
Source data: Field (or metric)
Description: Either a circle (for Pie Charts) or a ring (for Doughnut Charts) divided into segments, so you can easily see proportions that make up a whole
Use case example: Count of Companies, split by Owner
Who is this article for?
Planhat Users who are designing Dashboard and Presentation Pages (e.g. CS Ops)
What are Pie and Doughnut Charts?
You're no doubt already familiar with Pie Charts, as they are a very simple and standard type of chart! They consist of a circle divided into segments - so, for example, you could look at the Conversation model (object) and split it by Conversation Type, so you could see that 25% of your Conversations are emails, and 15% are tickets, and so on.
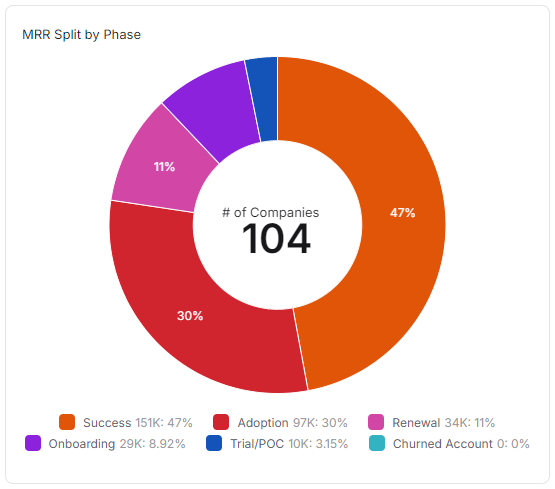
Doughnuts are exactly the same, but with a hole in the middle! This is just a different design option - and in Presentation Pages you can layer Widgets on top of each other, and it works well to place a KPI Widget in the middle, as shown in the example below.
Why use Pie and Doughnut Charts?
Pie and Doughnut Charts are part of the "Share Charts" category, and are great for giving you a quick view of:
A snapshot of current data
Splitting data up based on qualitative categories
Displaying relative proportions (with less focus on absolute values, although they can be displayed)
For example, you could use a Pie Chart or a Doughnut Chart to analyze and visualize:
Which CSM is managing the most Companies
Whether most of the Companies in a portfolio have high or low Health Scores
What proportions of ARR come from different geographical regions
... and many more use cases!
If we think about it the language of the Widget setup steps (more on this in the next section!), use cases include:
Count of Conversations, split by Type
Count of Tasks, split by Status ("overdue" / "not yet due" etc.)
Count of Companies, split by Owner
Count of Companies, split by Health Score
Count of Churn, split by Reason
Company model - sum of ARR, split by Phase
Company model - average Health Score, split by Owner
We bet you can think of even more examples!
How to set up a Pie or Doughnut Chart
The main steps are:
Choose a data model (object) - e.g. Company
Choose what the "whole" represents - either:
Counting the number of records - e.g. number of Companies
Or a property (from a choice of metrics and fields) plus an operation (sum, average, max or min) - e.g. sum of ARR
Choose what category property defines the segments/wedges - e.g. Company Phase
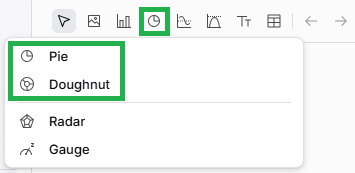
If you want to go back and edit your Pie or Doughnut Chart later on, it's easy to do so. While viewing the Page in Edit mode, mouse over the Widget (Chart), and click on the pencil icon to open up the Widget setup form again.
Pro tips
We've already covered these earlier in this article, but just to highlight them:
Select the "Show percentage" checkbox (in the "Customization" tab) to show percentages on the Pie/Doughnut Charts themselves and the legend if applicable
You can configure custom segments (in the "Customization" tab) - here you can define your own groupings, choosing which values belong in each group/segment, and what the segment color/names should be
Ensure the "Limit results (max no. of items)" (in the "Setup" tab) is blanked out before you begin configuring custom segments
See the "How to set up a Pie or Doughnut Chart" section above for further details and a screenshot
In Presentation Pages, you can layer widgets - so try positioning a KPI Widget in the hole of a Doughnut Chart
If you start configuring a Pie or Doughnut and then want to switch your Chart to the other type, you can easily do that in the setup form (using the "Chart Type" field), without losing the configuration you have already set
Comparison with other Widgets
As we've discussed in this article, Pie Charts and Doughnut Charts are almost identical to each other! The only difference is the hole in the middle of a Doughnut Chart.
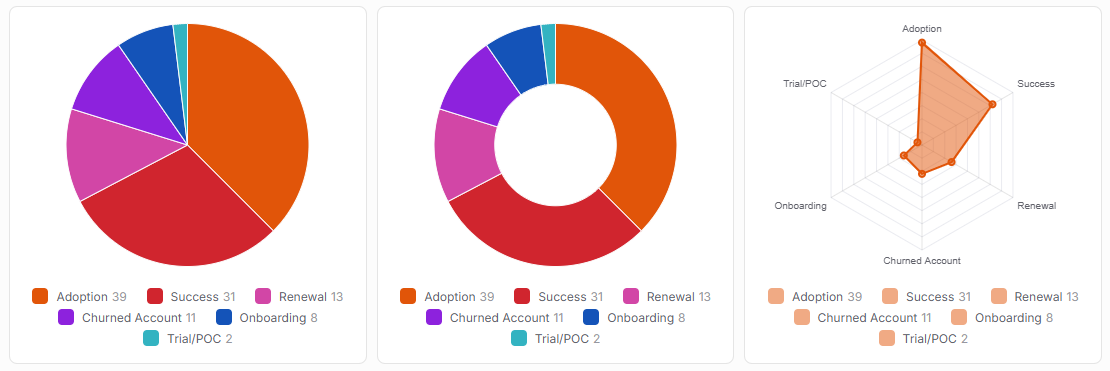
Pie and Doughnut Charts have some similarities to Radar Charts, which are also part of the "Share Charts" category. Radar Charts display pretty much the same data, but visualise the proportions in a slightly different way: rather than wedges, the Radar is a web-like representation, with points representing each category's contribution to the total. Note that you can’t define custom segments on this type of chart.
Here is the same data displayed in a Pie, Doughnut and Radar.
Click the image to view it enlarged