Automation logs and troubleshooting
Automations contain extensive logs, so you can see when an Automation was triggered and what happened in each step. The logs can also help when you are building a new Automation
Summary
If you think an Automation should have run, but you don't see the expected results, you can use Automation logs to check:
Whether the Automation was actually triggered
Whether the Automation encountered any errors
In this article, we list the steps to follow to troubleshoot any issues
We also go though a methodical process to test out a new Automation you've created, checking the logs to help resolve any configuration problems, before the Automation is used on "real" data
Who is this article for?
Planhat Users who are building/managing Automations for their organization (e.g. Tech/Ops)
Series
This article is part of a series on Automations:
How to choose between Automations and other Planhat features
Automation logs and troubleshooting ⬅️ You are here
Automation failures - adjustable thresholds and notifications
Article contents
Introduction
If you're building new Automations or managing existing Automations, then it's important that you know how to troubleshoot them.
If you think an Automation should have been triggered, but you don't see the result (e.g. data change) you were expecting, there are two main possibilities:
The Automation has not run - it was never triggered (e.g. because the trigger has been set up incorrectly, or you made a mistake and did not correctly carry out the action set to trigger the Automation)
The Automation did run, but something went wrong in the process (e.g. because a mistake was made in a replacement code in a step, or the desired action wasn't correctly configured in the step)
In this article, we'll teach you all about Automation logs, and then detail the process of troubleshooting Automations to help you swiftly get them operational!
We also describe our recommended process of methodically testing a new Automation, making use of the logs to resolve any issues, before the Automation is set live on real data.
🚀 Tip
In addition to troubleshooting, Automation logs can also be really helpful to give you information when you're building Automations - you can read an example use case here.
Where to find Automation logs
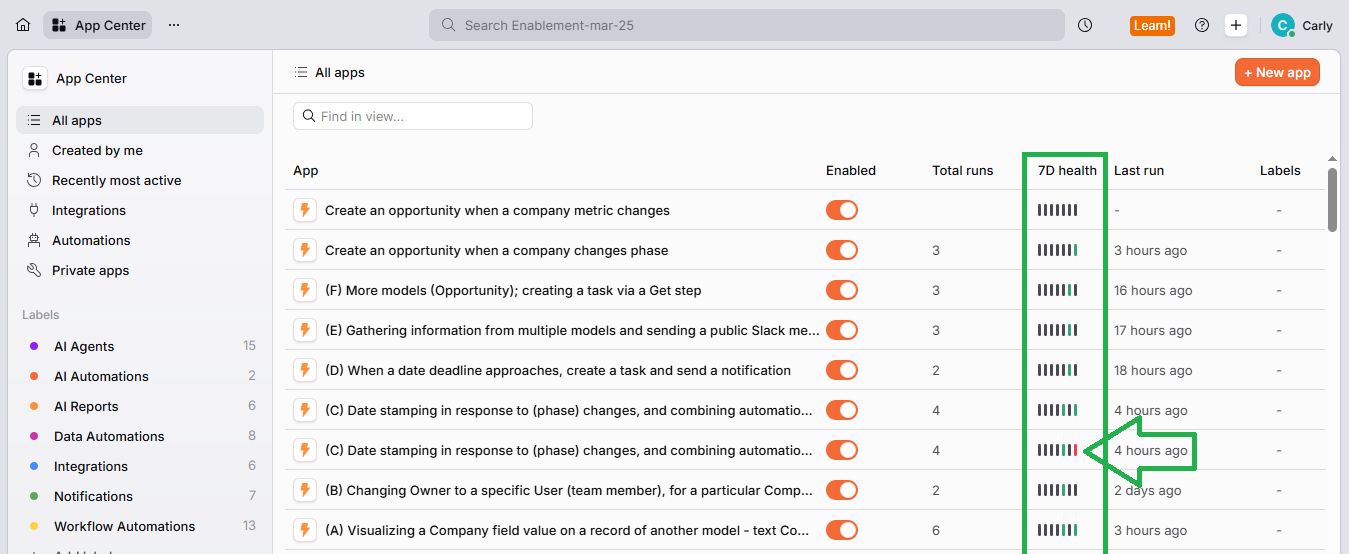
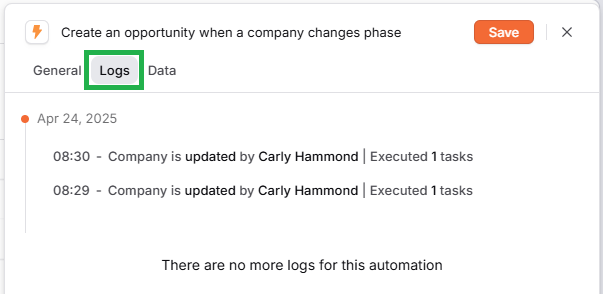
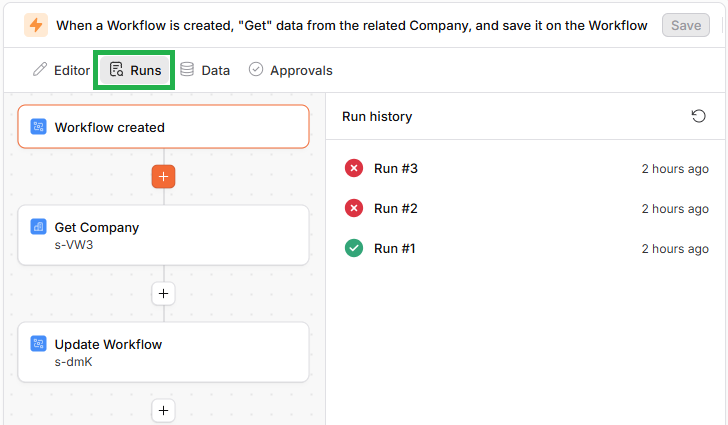
The execution logs are located in the "Logs" tab of Templated Automations and the "Runs" tab of Custom Automations - simply click on your Automation within the App Center to open it up, then select the relevant tab:
Templated Automation
Custom Automation
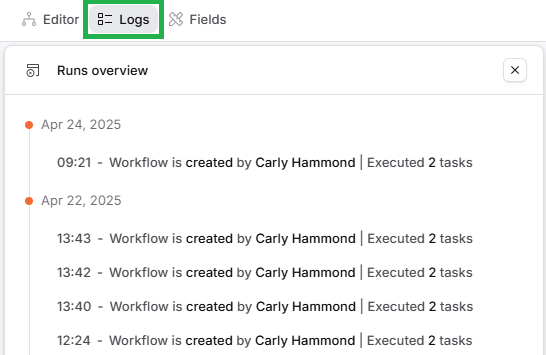
Runs (executions) within the "Logs" tab
We are first going to go through the older style of logs, pictured below. This was originally the format of logs used for both Templated Automations and Custom Automations, but now it's only used for Templated Automations. We will then go through the newer structure for Custom Automations later in this article.
The logs are arranged with the most recent run at the top, and the run furthest in the past at the bottom. Each run (execution) is shown on its own line, with a timestamp of when the Automation was triggered.
If the Automation run fails, it will show in red, like so:
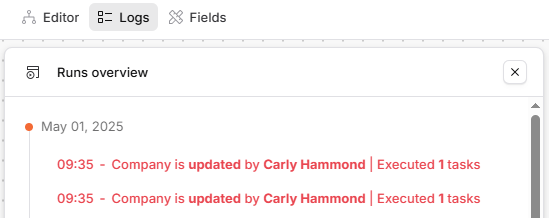
You can click on each line (i.e. each run/execution) to open it up and see its details. When you first click, you'll see a line for the "event details" (i.e. the trigger event), and then separate lines for each step of the Automation.
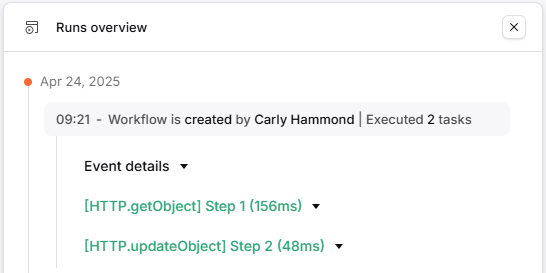
If a step has run successfully, it will show in green, like in the examples above. If, however, the step encountered an error (e.g. because you made a typo in a replacement code), it will show in red, like in the example below. This enables you to identify which step of the Automation the error occurred in.
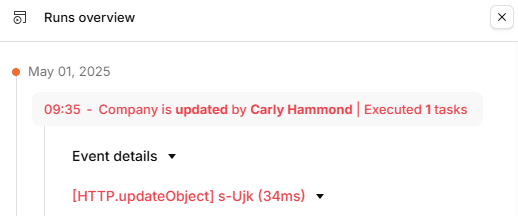
You can then click on any of these lines (i.e. "Event details" and also the line per step) to open up further details for additional investigation - we'll go through this next.
🚀 Tip
Templated Automations are pre-configured, but actually function like Custom Automations "under the hood" - they just have a simplified UI on top, which is what you interact with. This means that the actual Automation may involve multiple action steps (e.g. "Get" steps) even if that's not immediately obvious from the Template; each of these steps will show in the logs.
Event details
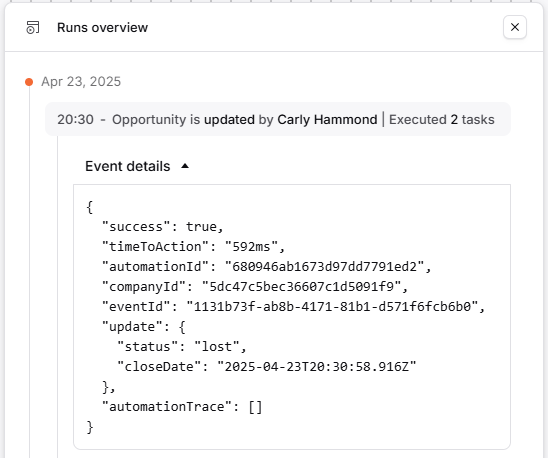
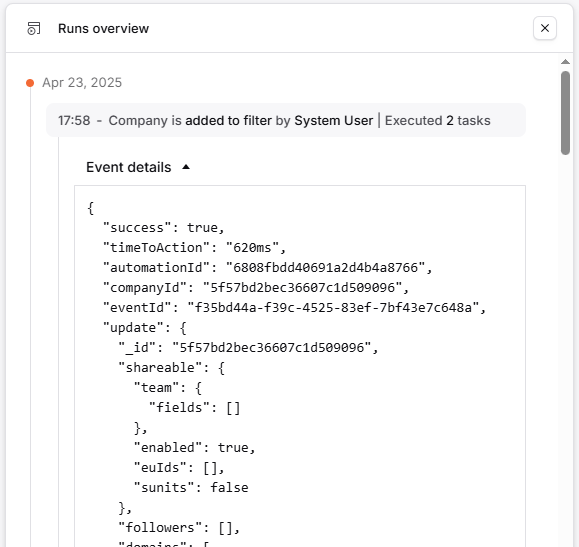
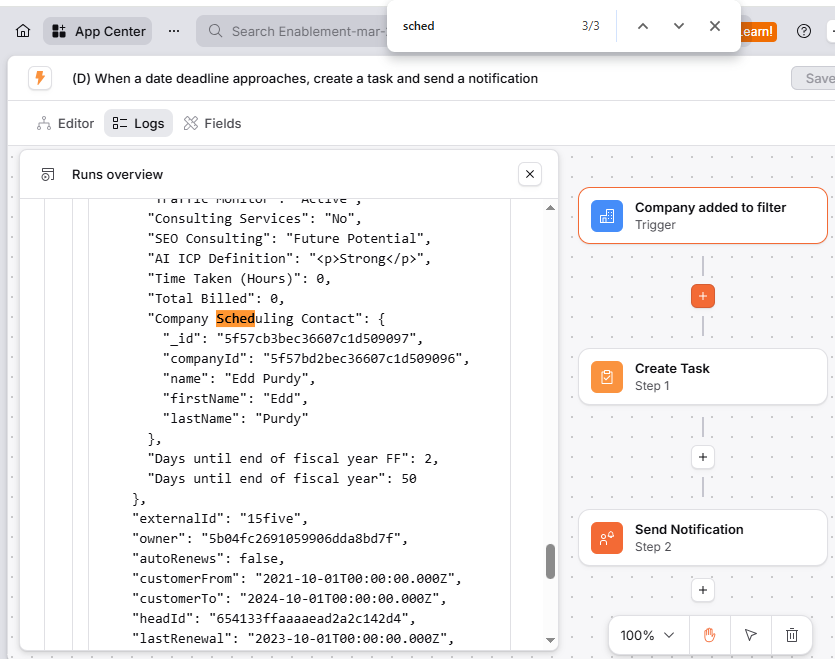
Clicking on "Event details" will provide full context on the exact event that resulted in the Automation being triggered. The details are structured as a JSON, and are searchable using the usual "find" keyboard shortcut (Ctrl+F / Cmd+F).
"companyId"is (as you may expect from the name) the ID of the related Company"update"is a nested expression that either shows you the data change that triggered the Automation (if the trigger was set to created/updated); or, if the Automation was triggered by a filter, the logs will provide you with a full list of the trigger record properties, rather than just the specific data change that triggered the Automation - this is where the Ctrl+F etc. really comes in useful
🚀 Tip
"Event details" is a great place to find out how to refer to your desired fields (properties) in replacement codes when configuring Automations. For example, you can see API names for standard fields, such as
"customerFrom"in the example screenshot above. And you can see if properties are nested, like in the "Company Scheduling Contact" field also in the example screenshot above - to get the name, you'd need to refer to"custom.Company Scheduling Contact.name", as we describe in our worked examples article.
Steps
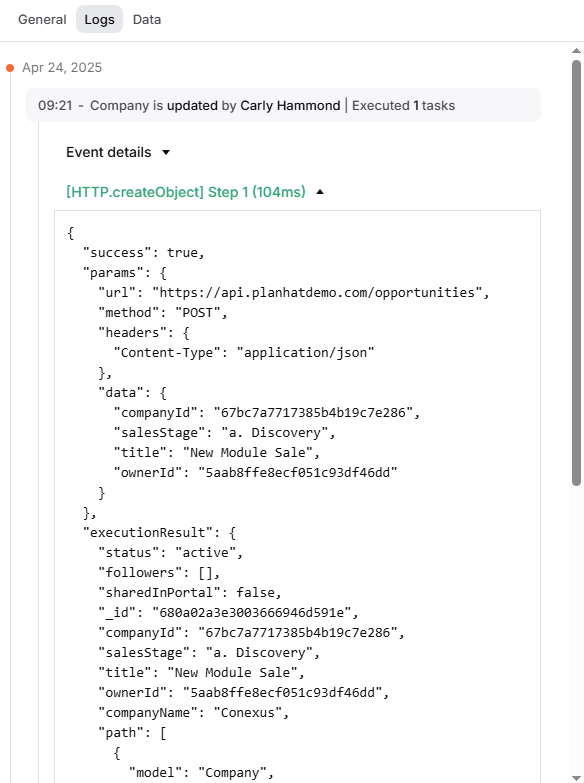
Clicking on a line in the logs corresponding to an Automation step (which will show in either red or green, as mentioned above) will provide information on what happened when that step tried to run. Like the event details, this will be structured as a searchable JSON.
"success"will take a value either of "true" (if the Automation step was executed successfully) or "false" (if the Automation step was unsuccessful)"executionResult"provides a summary of what the execution was (if successful) and a summary of why the execution was unsuccessful (if it failed)Within "data", you can see any error message, to help you identify the cause of any issue
Here are couple of examples, showing a successful step and a failed one.
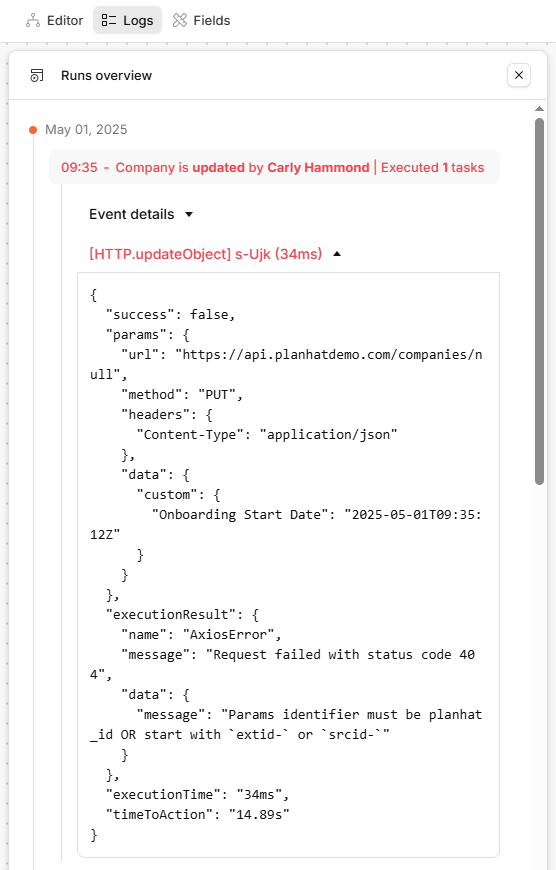
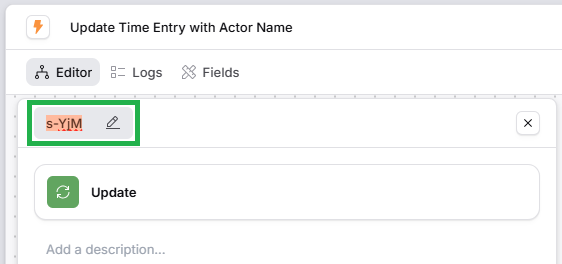
The error example above was caused by a typo in a replacement code, as shown below. Looking in the main "Editor" tab of the Automation, opening up that step in the configuration panel, I can see that this ID dynamic reference is wrong - it should be <<object._id>>.
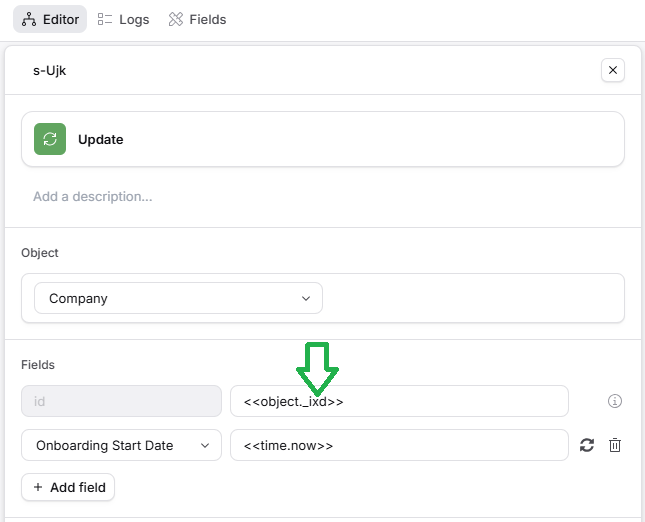
🚀 Tip
To help avoid typos in replacement codes like in the example above, start typing
<<into the box, and then select from the dropdown list, rather than typing it out. If there are a lot of options in the dropdown, you can type some more of your desired code (e.g.<<object) before selecting your choice of code from the dropdown list.
Runs (executions) within the "Runs" tab
We are now going to review the newer style of logs for Custom Automations, which you can find in a "Runs" tab rather than a "Logs" tab. Some of the principles are the same as we discussed above, but we will highlight differences below.
The newer version of logs, which you will now see for Custom Automations, look something like this:
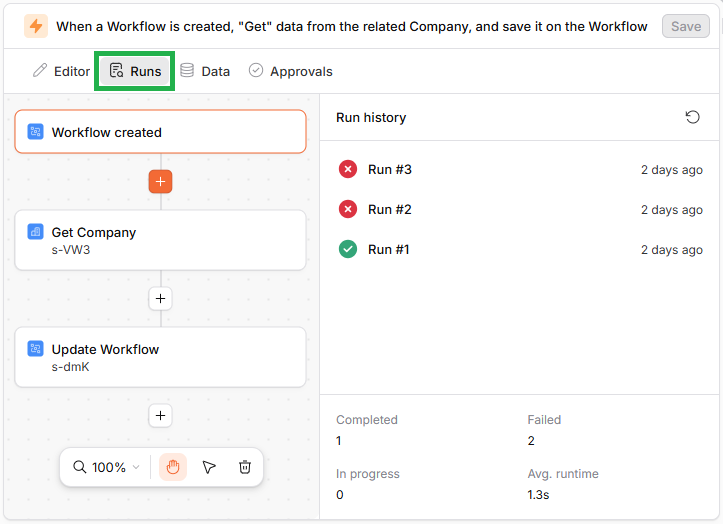
As with the other style of Automation logs, these are arranged with the most recent run at the top, and the run furthest in the past at the bottom.
At a quick glance, you can see from the green checkmarks (ticks) and the red cross icons whether each run (execution) was successful or failed.
At the bottom of the panel shown above, you can see a summary of run statistics for the Automation as a whole.
Like with the other format of Automation logs, you can click on each run to open it up and see its details - both the "event details" (related to the trigger) and the individual step details. However, these logs are displayed in a different way: as an interactive flow chart, similar to what you see when configuring Custom Automations.
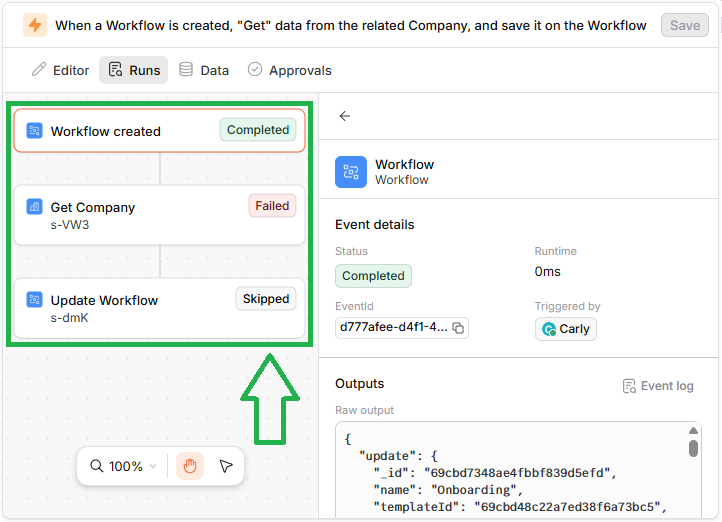
Within these logs, the flow chart - showing the trigger and steps of the Automation in question - have colored labels to show:
What completed successfully - this is likely configured correctly
What failed - this is flagged to you as the likely location of an issue within the Automation configuration
What was skipped - noting that steps after a failed one will be skipped
With this style of logs, you click on each step (or trigger) in the flow chart, and the panel on the other side shows you the details of what you have clicked on. By default, when you open the logs, the trigger will be selected, and you will see "Event details" to the side.
Event details
With the trigger selected, you will see a panel like this on the right-hand side:
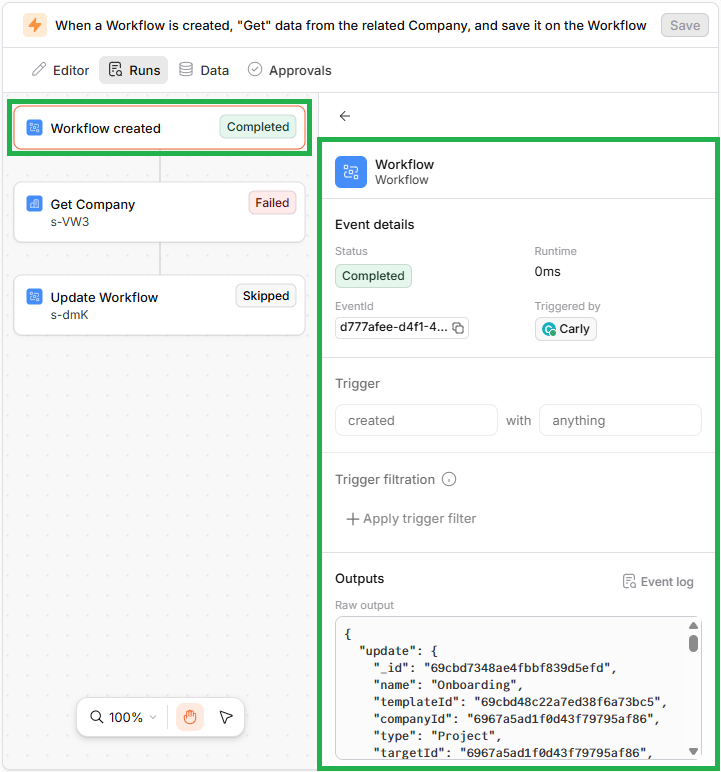
At the top you can see a summary with some key data (including which Planhat User triggered the Automation run), and at the bottom, in "Outputs", you can see the actual event details log that we described earlier in this article.
🚀 Tip
If you want to view the raw output in a larger box, click on "Event log" to open it up in a separate modal.
Steps
Clicking into a step, again you can see its details in the panel on the right-hand side.
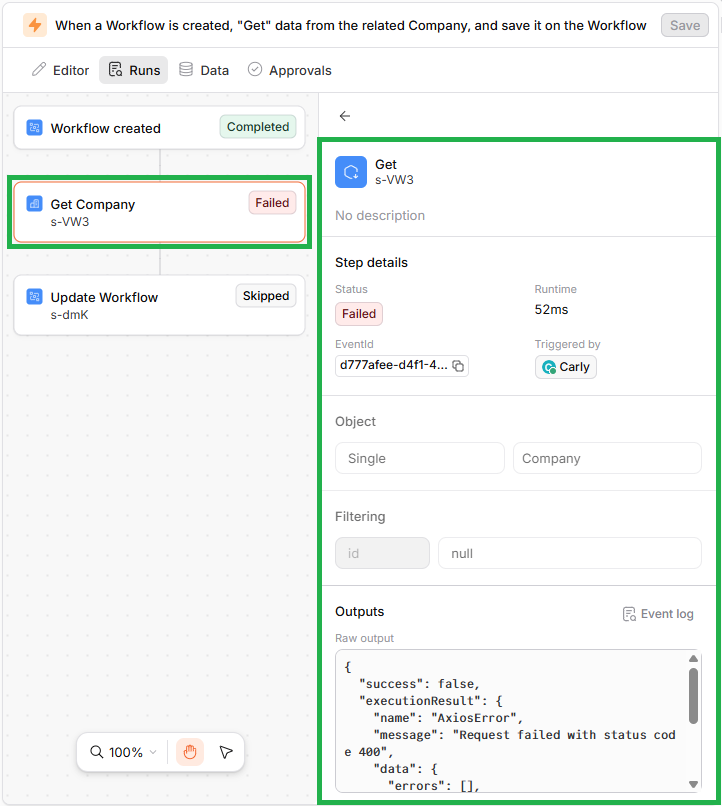
As with the trigger (event details), at the bottom, in "Outputs", you can you can see the actual step logs that we described earlier in this article.
🚀 Tip
If you want to view the raw output in a larger box, click on "Event log" to open it up in a separate modal - like in the example screenshot below.
Like in a previous example in this article, here there is an error message that points to why the step failed.
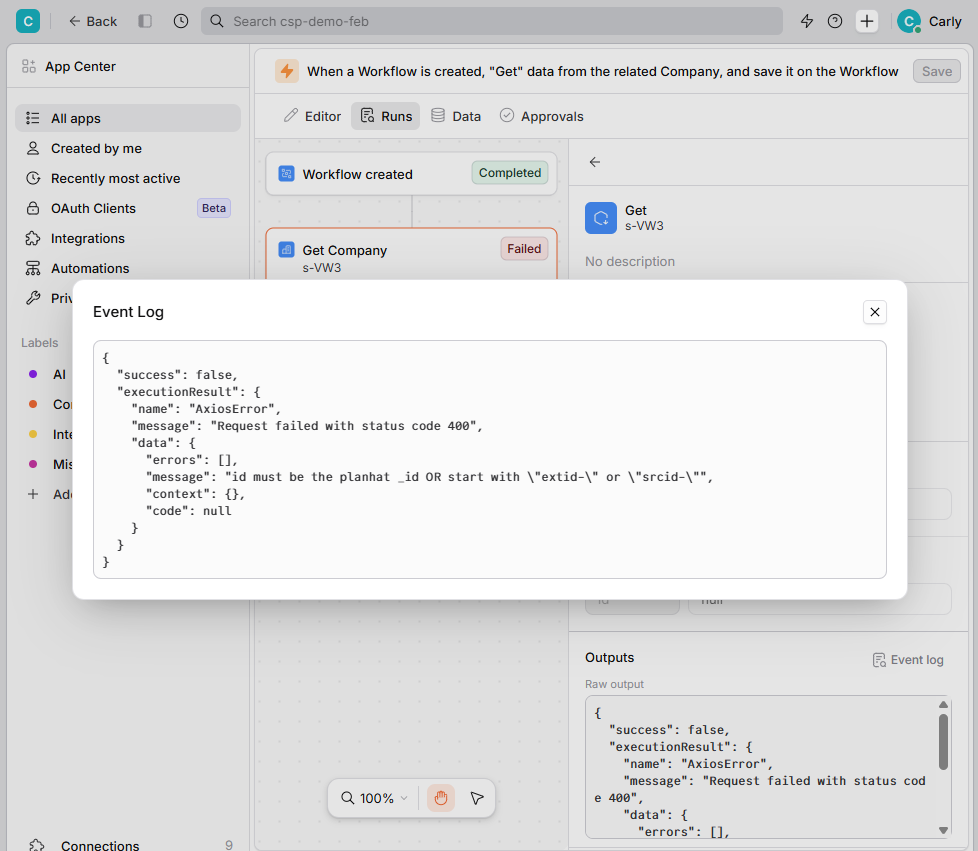
Click the image to view it enlarged
To investigate further, you can click into the "Editor" tab, ensure the relevant step is selected in the flow chart, and then view the details on the right-hand side.
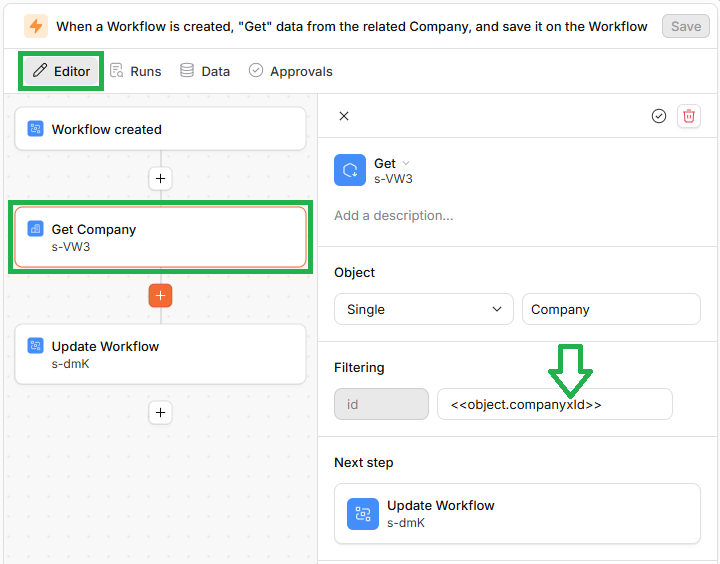
In this particular case, there is an error in the replacement code (like previously shown in this article).
Troubleshooting Automations
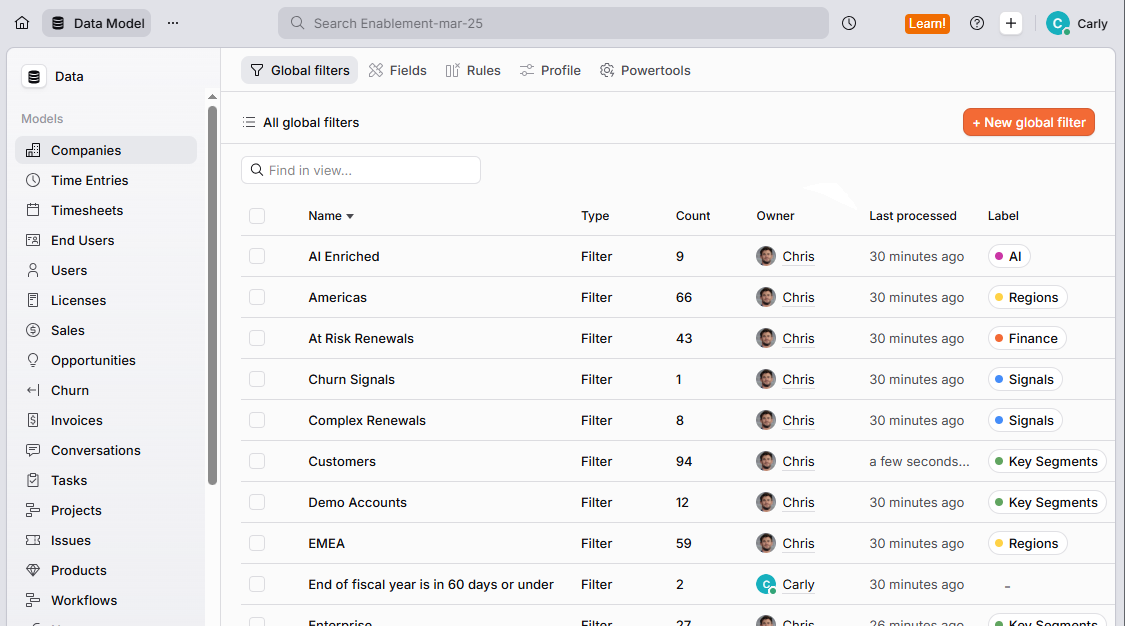
If you've set up an Automation but don't see your expected results, then follow this quick and simple process to troubleshoot what happened.
📚 Further reading
If you would like to receive notifications when an Automation fails, check out this article.
AI Automations
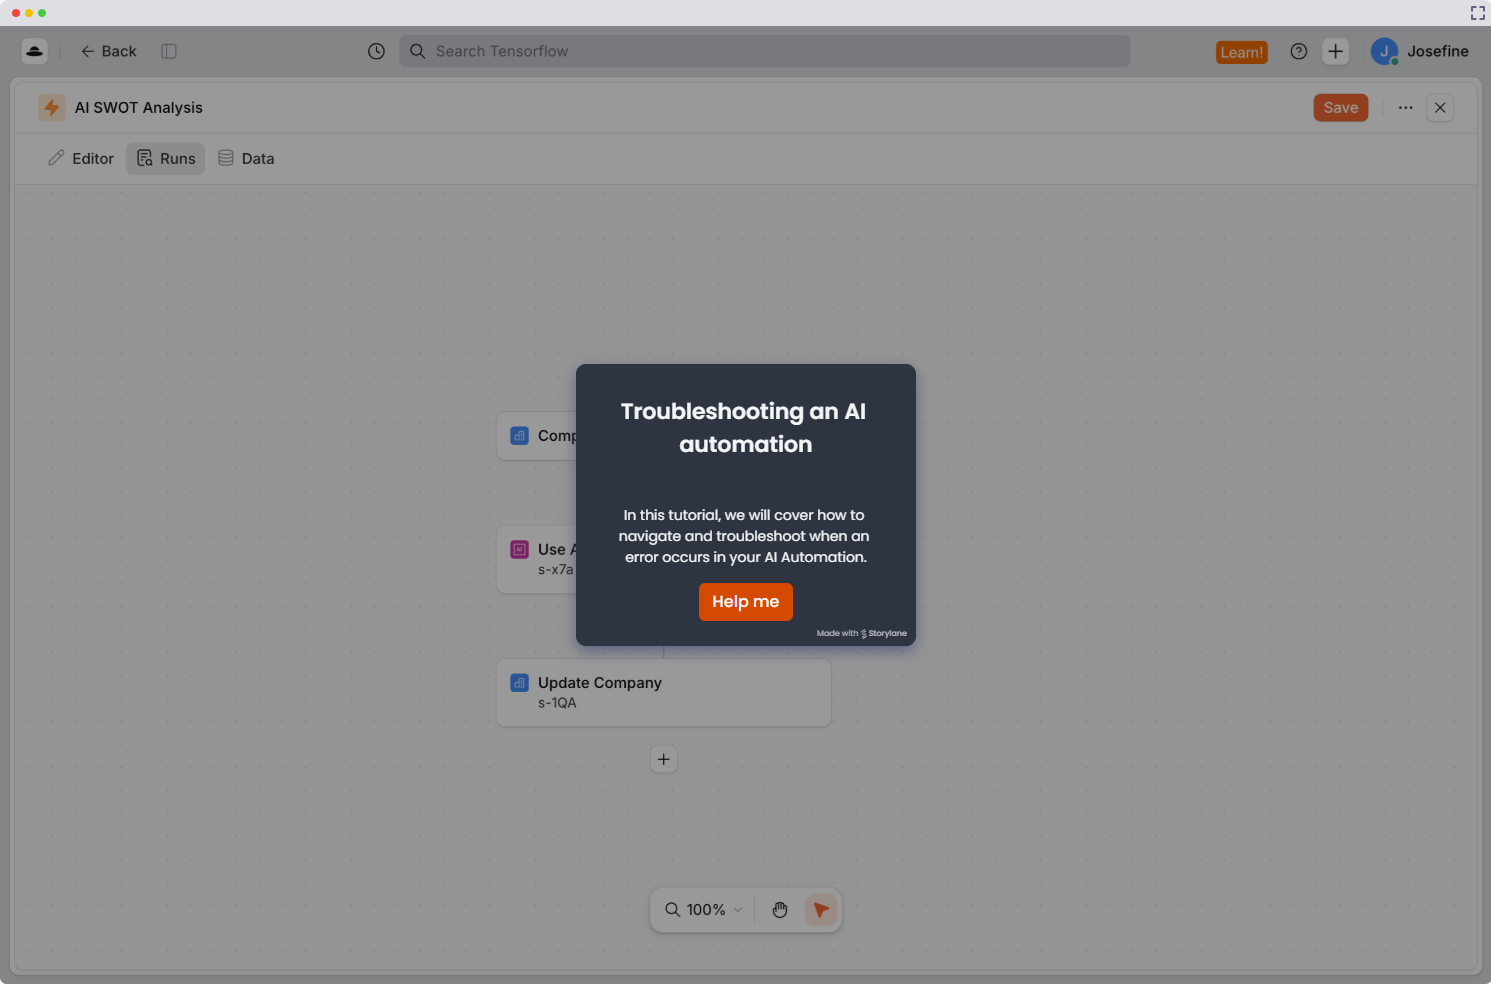
For help with troubleshooting AI Automations (Automations with "Use AI" steps):
See this article section for error message explanations
Check out the tutorial below for a quick troubleshooting guide
How to test an Automation before it goes live
Everything above in this article describes how to investigate an Automation that has already run. The best time to use those logs, though, is before your Automation touches real customer data - particularly when it sends emails, updates customer-facing fields, or runs over days or weeks via "Wait" and "Wait Until" steps and multiple branches.
Here is a testing process we recommend:
Duplicate the Automation, and set the copy's trigger to "manual action". Working on a duplicate means your real Automation stays untouched, and a manual trigger lets you run the test on demand against a record of your choosing, rather than waiting for real data to change
🚀 Tip: Give the duplicate a clearly recognizable name, e.g. prefixed with [TEST], so nobody mistakes it for the "real" Automation later
Create a dummy data record. You can do this in Data Explorer. For example, if you are testing an Automation triggered on a Company data model, you can create a dummy Company with a few dummy End Users. Use your own email addresses for the dummy End Users (e.g. you can sign up for free Gmail accounts), so that any emails the Automation sends arrive in your inbox rather than a customer's
Run the Automation on the dummy data record, and check the logs upon any failure. Even after a careful review, a first run will often hit an error or two. Open the "Runs" tab (as described earlier in this article), find the failed step, and use the error details to diagnose it
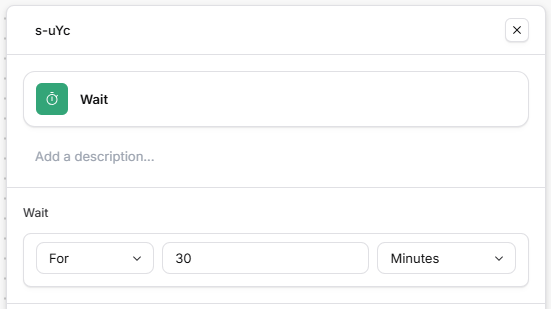
🚀 Tip: In your Automation copy, you can reduce the durations in any "Wait" steps - and the expiration on any "Wait Until" steps - so you aren't waiting days for the next step to execute
If you want to be thorough, repeat until you have covered every path. Update fields on the dummy record, and simulate the End User behavior the Automation reacts to (e.g. opening or replying to an email) if needed, running the Automation as many times as it takes to exercise each branch and each "Wait Until" path at least once
Switch back to the real setup and do a final check. Restore the original trigger and trigger filtration, and put your real Wait durations back. Then create/update a dummy record that genuinely meets the trigger conditions, and confirm the Automation fires and behaves as expected. If it does, you're ready for production
📌 Important to note
Before you finish, tidy up after your test: disable or delete the "[TEST]" duplicate Automation so it can't run against live data, restore any changes you may have made to the "real" Automation (e.g. any durations you shortened), and remove or park the dummy Companies and End Users so they don't distort your filters, reporting or email metrics.
🚀 Tip
For an extra safety net on the first live runs, consider adding Human-in-the-Loop (HITL) to any step that sends something to a customer. You can then review each action before it goes out, and remove the HITL check once you're confident in the Automation.